import numpy as np
import matplotlib.pyplot as plt
from scipy.stats import norm
from scipy.stats import gaussian_kde
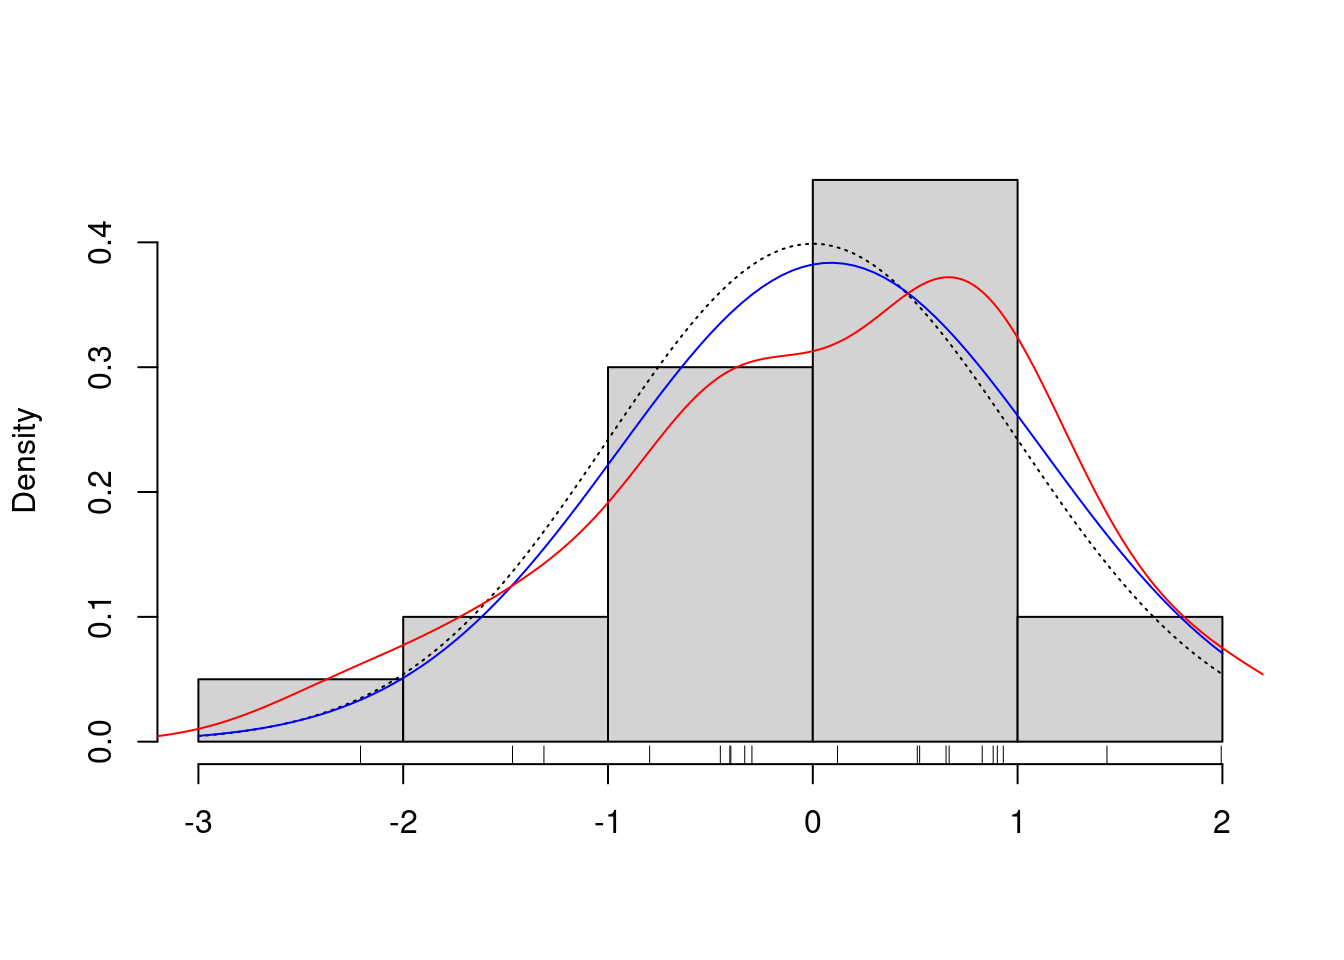
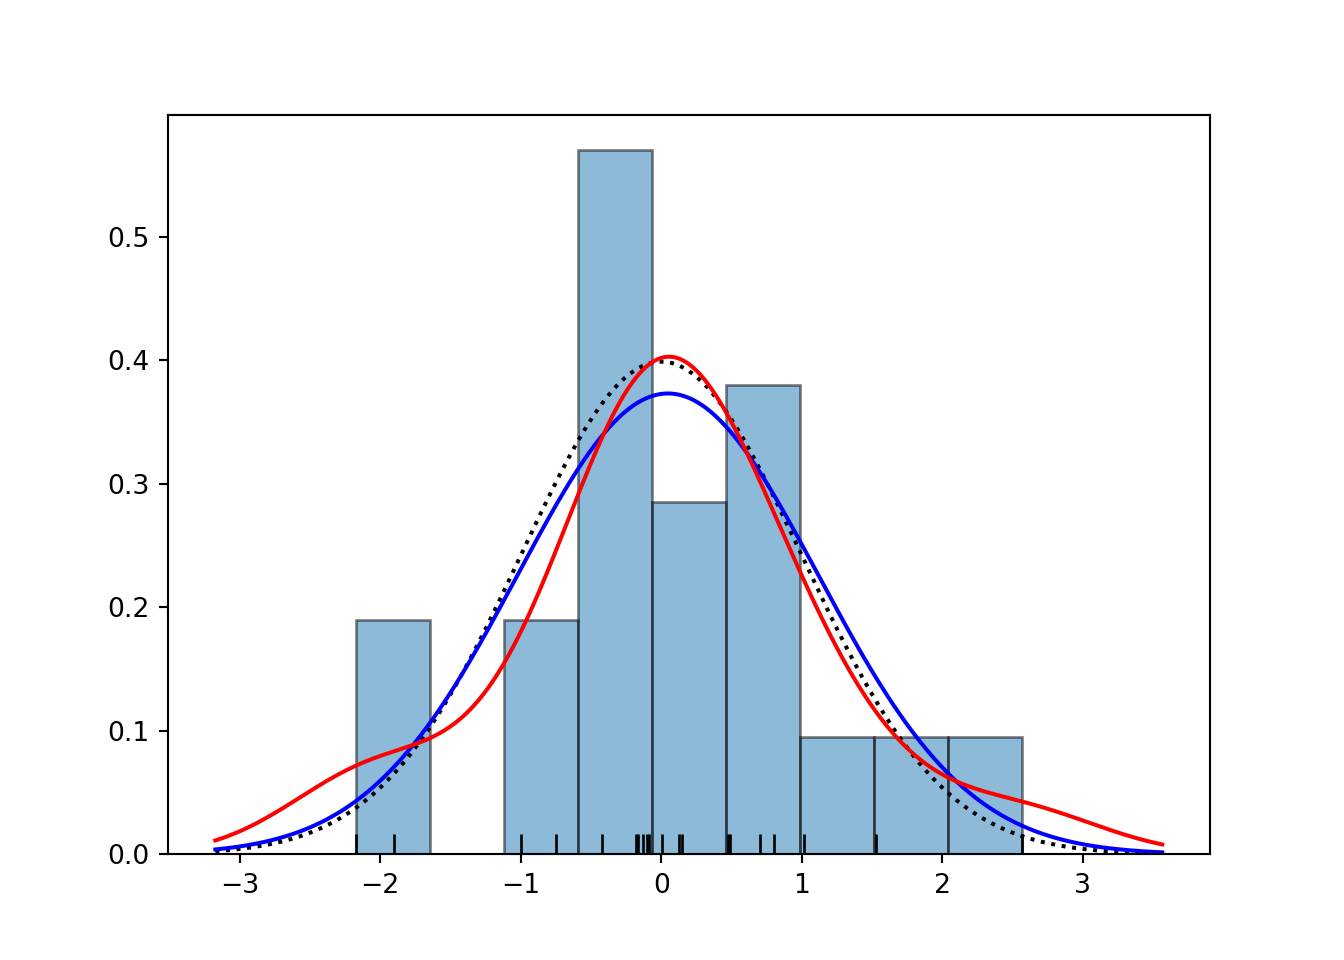
points = np.random.normal(size=20)
plt.hist(points, bins='auto', density=True, alpha=0.5, edgecolor='black')
plt.plot(points, np.zeros_like(points), '|', color='black', markersize=15)
x = np.linspace(min(points) - 1, max(points) + 1, 1000)
plt.plot(x, norm.pdf(x), linestyle='dotted', color='black')
mu = np.mean(points)
sigma = np.std(points, ddof=1)
plt.plot(x, norm.pdf(x, mu, sigma), color='blue')
kde = gaussian_kde(points)
plt.plot(x, kde(x), color='red')
plt.xlabel('')
plt.title('')
plt.show()