import numpy as np
import matplotlib.pyplot as plt
from math import log2, sqrt
c = 1
pos = c * 50
neg = 50
def entropy(P, N):
if P == 0 or N == 0:
return 0
p = P / (P + N)
n = N / (P + N)
return -p * log2(p) - n * log2(n)
def gini(P, N):
p = P / (P + N)
n = N / (P + N)
return 4 * p * n
def dkm(P, N):
p = P / (P + N)
n = N / (P + N)
return 2 * sqrt(p * n)
def metric(tp, fp, m):
Pos = pos
Neg = neg
N = Pos + Neg
TP = tp
FP = fp
FN = Pos - TP
TN = Neg - FP
if tp + fp == 0:
return 0
if m == 'accuracy':
return (TP + TN) / N
elif m == 'wracc':
return TP / N - (TP + FP) * (TP + FN) / (N ** 2)
elif m == 'precision':
return TP / (TP + FP)
elif m == 'f-measure':
return 2 * TP / (2 * TP + FP + FN)
elif m == 'gini':
return gini(Pos, Neg) - ((TP + FP) / N) * gini(TP, FP) - ((FN + TN) / N) * gini(FN, TN)
elif m == 'entropy':
return ((TP + FP) / N) * entropy(TP, FP)
elif m == 'dkm':
return dkm(Pos, Neg) - ((TP + FP) / N) * dkm(TP, FP) - ((FN + TN) / N) * dkm(FN, TN)
else:
return 0
def rocgrid():
fig, ax = plt.subplots(figsize=(6, 6))
ax.set_xlim(0, neg)
ax.set_ylim(0, pos)
ax.set_xlabel('Negatives')
ax.set_ylabel('Positives')
ax.set_xticks(np.arange(0, neg+1, 10))
ax.set_yticks(np.arange(0, pos+1, 10))
ax.grid(True, color='gray', linestyle='--', linewidth=0.5)
return ax
def contour1(ax, m, color, linestyle, tp, fp):
x = np.arange(0, neg+1)
y = np.arange(0, pos+1)
Z = np.zeros((len(y), len(x)))
for i, xi in enumerate(x):
for j, yj in enumerate(y):
Z[j, i] = metric(yj, xi, m)
v = metric(tp, fp, m)
CS = ax.contour(x, y, Z, levels=[v], colors=color, linestyles=linestyle)
ax.plot(fp, tp, 'o', color=color)
ax = rocgrid()
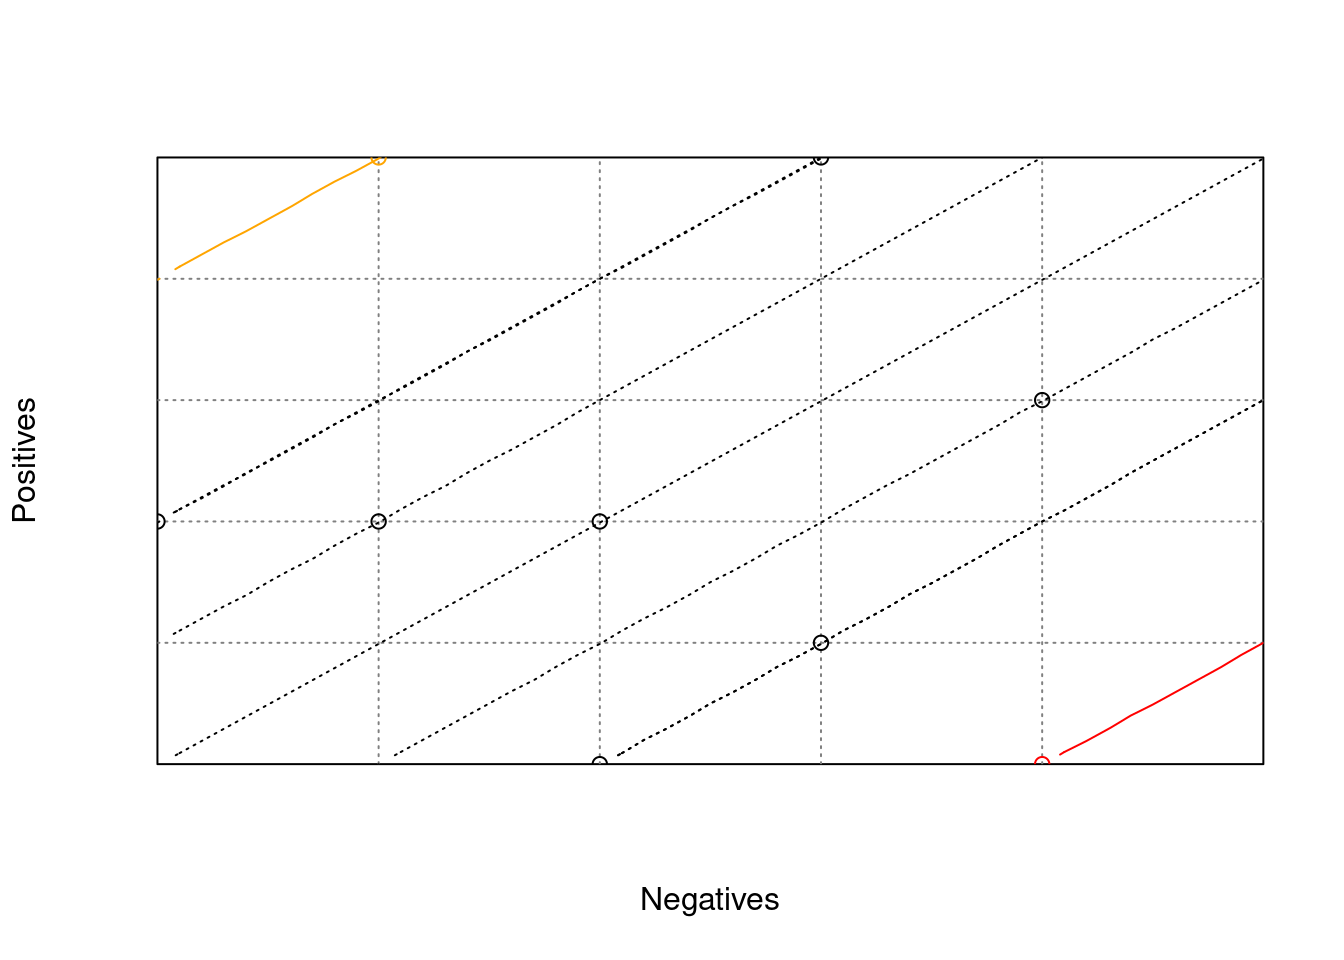
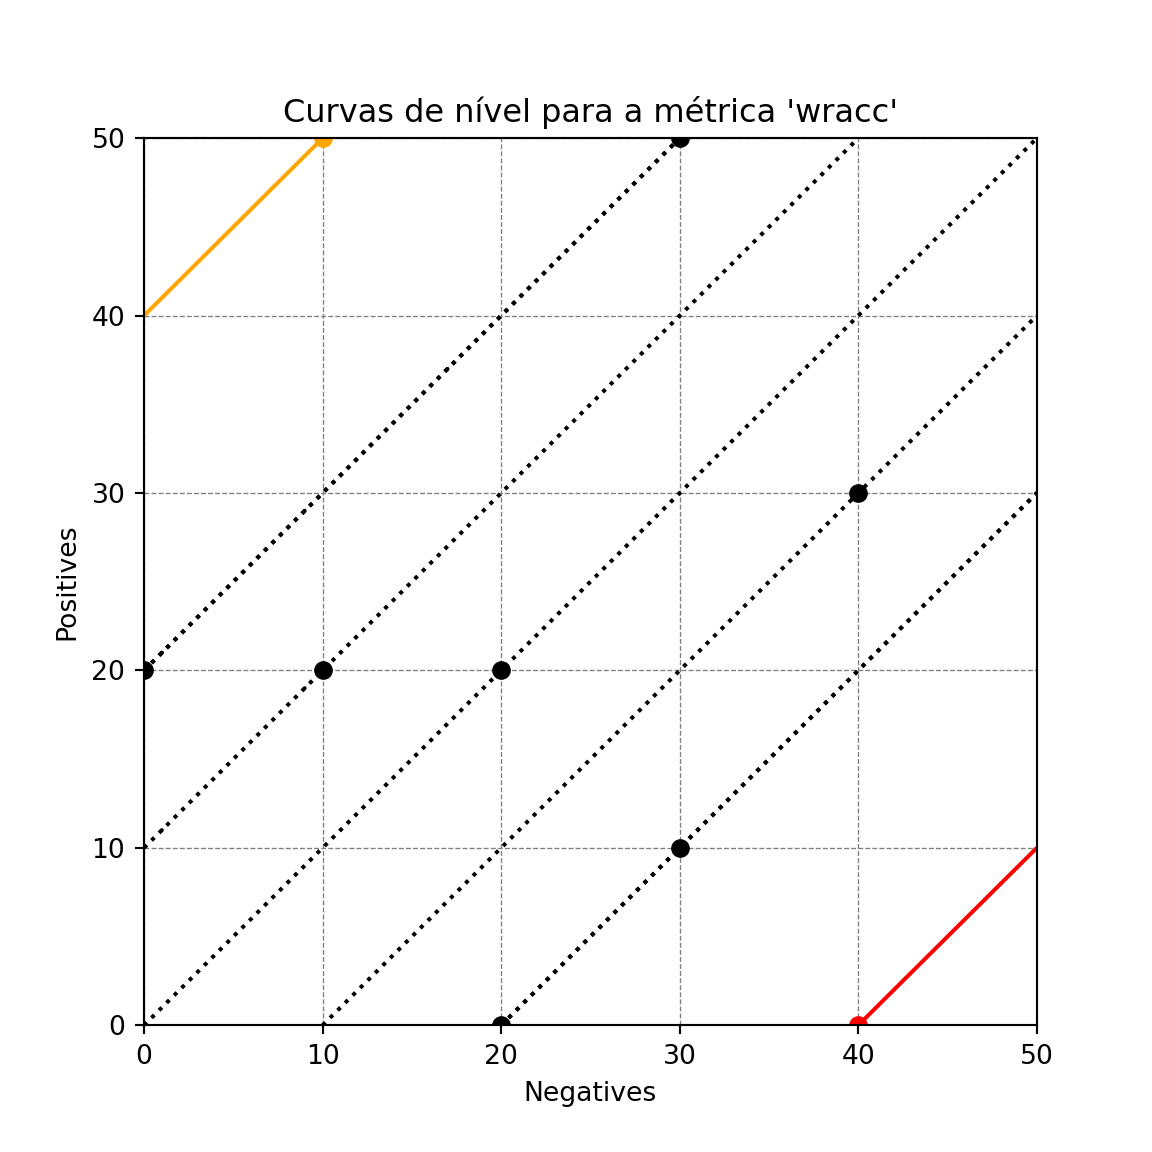
method = 'wracc'
d = 1
contour1(ax, method, 'red', 'solid', 0, 40)
contour1(ax, method, 'black', 'dotted', 10, 30)
contour1(ax, method, 'black', 'dotted', 20, 20)
contour1(ax, method, 'black', 'dotted', 20, 0)
contour1(ax, method, 'orange', 'solid', 50, 10)
contour1(ax, method, 'black', 'dotted', 50, 30)
contour1(ax, method, 'black', 'dotted', 0, 20)
contour1(ax, method, 'black', 'dotted', 30, 40)
contour1(ax, method, 'black', 'dotted', 20, 10)
plt.title("Curvas de nível para a métrica 'wracc'")
plt.show()