import numpy as np
import matplotlib.pyplot as plt
def entropy(P, N):
if P == 0 or N == 0:
return 0
p = P / (P + N)
n = N / (P + N)
return -p * np.log2(p) - n * np.log2(n)
def gini(P, N):
if P + N == 0:
return 0
p = P / (P + N)
n = N / (P + N)
return 4 * p * n
def dkm(P, N):
if P + N == 0:
return 0
p = P / (P + N)
n = N / (P + N)
return 2 * np.sqrt(p * n)
def minacc(P, N):
if P + N == 0:
return 0
p = P / (P + N)
n = N / (P + N)
return min(p, n)
def metric(tp, fp, Pos, Neg, m):
N = Pos + Neg
TP = tp
FP = fp
FN = Pos - TP
TN = Neg - FP
if TP + FP == 0:
return 0
if m == 'accuracy':
return (TP + TN) / N
if m == 'wracc':
return TP / N - (TP + FP) * (TP + FN) / N**2
if m == 'generality':
return (TP + FP) / N
if m == 'precision':
return TP / (TP + FP)
if m == 'laplace-precision':
return (TP + 10) / (TP + FP + 20)
if m == 'f-measure':
return 2 * TP / (2 * TP + FP + FN)
if m == 'g-measure':
return TP / (FP + Pos)
if m == 'precision*recall':
return TP**2 / ((TP + FP) * (TP + FN))
if m == 'avg-precision-recall':
return TP / (2 * (TP + FP)) + TP / (2 * (TP + FN))
if m == 'balanced-aucsplit':
return TP / Pos - FP / Neg
if m == 'entropy':
return entropy(TP, FP) / 2
if m == 'giniimp':
return gini(TP, FP)
if m == 'dkmimp':
return dkm(TP, FP)
if m == 'minacc':
return minacc(TP, FP)
return 0
def contour1(ax, m, tp, fp, Pos, Neg, color, lty):
v = metric(tp, fp, Pos, Neg, m)
x = np.arange(0, Neg + 1)
y = np.arange(0, Pos + 1)
z = np.zeros((len(y), len(x)))
for i in range(len(x)):
for j in range(len(y)):
z[j, i] = metric(j, i, Pos, Neg, m)
ax.contour(x, y, z, levels=[v], colors=color, linestyles=lty, linewidths=2)
ax.plot(fp, tp, 'o', color=color, markersize=5)
def rocgrid(pos, neg):
fig, ax = plt.subplots(figsize=(8, 6))
ax.set_xlim(0, neg)
ax.set_ylim(0, pos)
ax.set_xlabel("Negatives")
ax.set_ylabel("Positives")
ax.set_xticks(np.arange(0, neg + 1, 10))
ax.set_yticks(np.arange(0, pos + 1, 10))
ax.grid(True, which='both', linestyle='--', linewidth=0.5)
return fig, ax
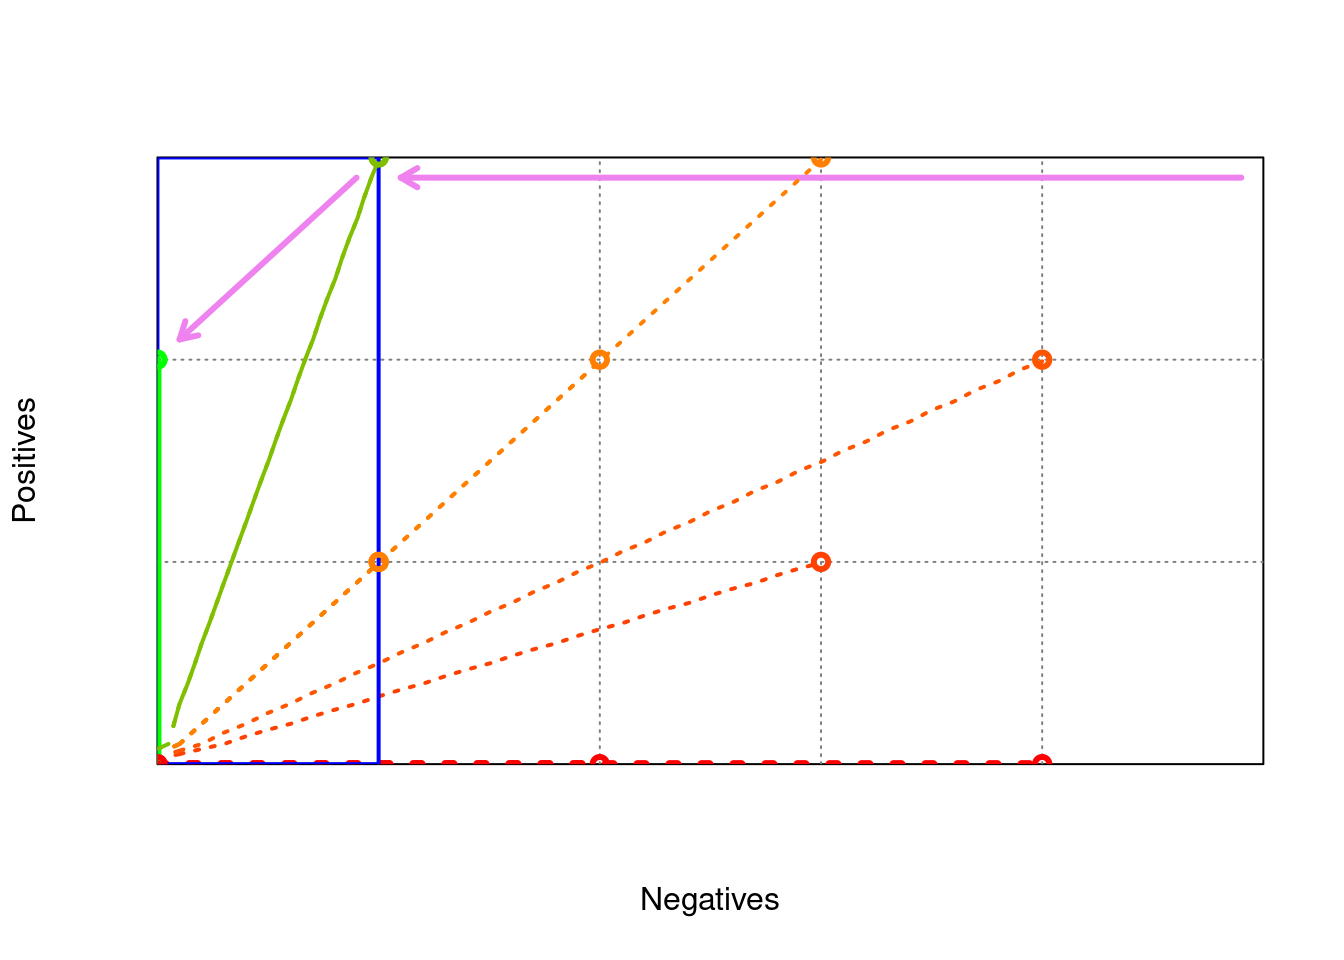
pos = 30
neg = 50
method = 'precision'
fig, ax = rocgrid(pos, neg)
ax.plot([0, neg, neg, 0, 0], [0, 0, pos, pos, 0], color='black', linewidth=2)
p = 30
n = 10
ax.arrow(neg - 1, pos - 1, n - neg + 2, p - pos - 2, head_width=1, head_length=1, fc='violet', ec='violet', linewidth=2)
contour1(ax, method, p, n, pos, neg, 'orange', 'solid')
test_points = [(10, 30), (20, 20), (0, 40), (30, 30), (0, 20), (20, 40), (10, 10), (0, 0)]
for tp, fp in test_points:
contour1(ax, method, tp, fp, pos, neg, 'black', 'dotted')
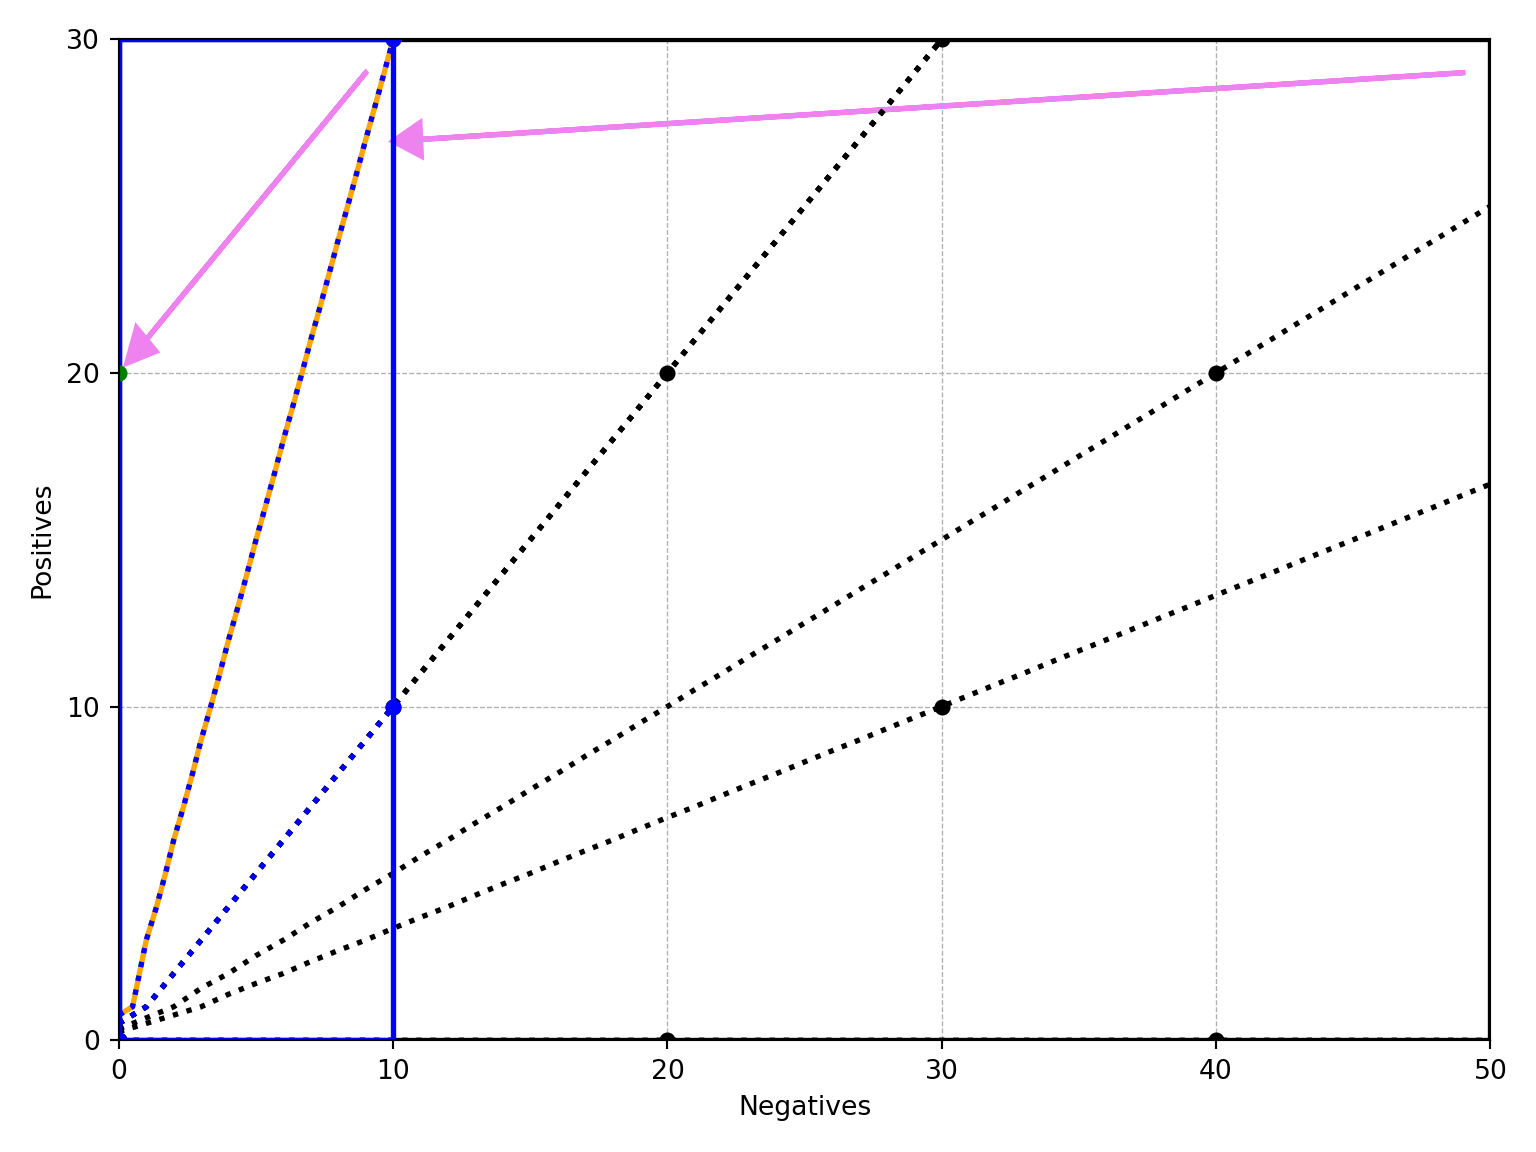
p1 = 20
n1 = 0
ax.plot([0, n, n, 0, 0], [0, 0, p, p, 0], color='blue', linewidth=2)
ax.arrow(n - 1, p - 1, n1 - n + 2, p1 - p + 2, head_width=1, head_length=1, fc='violet', ec='violet', linewidth=2)
contour1(ax, method, p1, n1, p, n, 'green', 'solid')
for tp, fp in [(10, 10), (30, 10), (0, 0)]:
contour1(ax, method, tp, fp, p, n, 'blue', 'dotted')
plt.tight_layout()
plt.show()