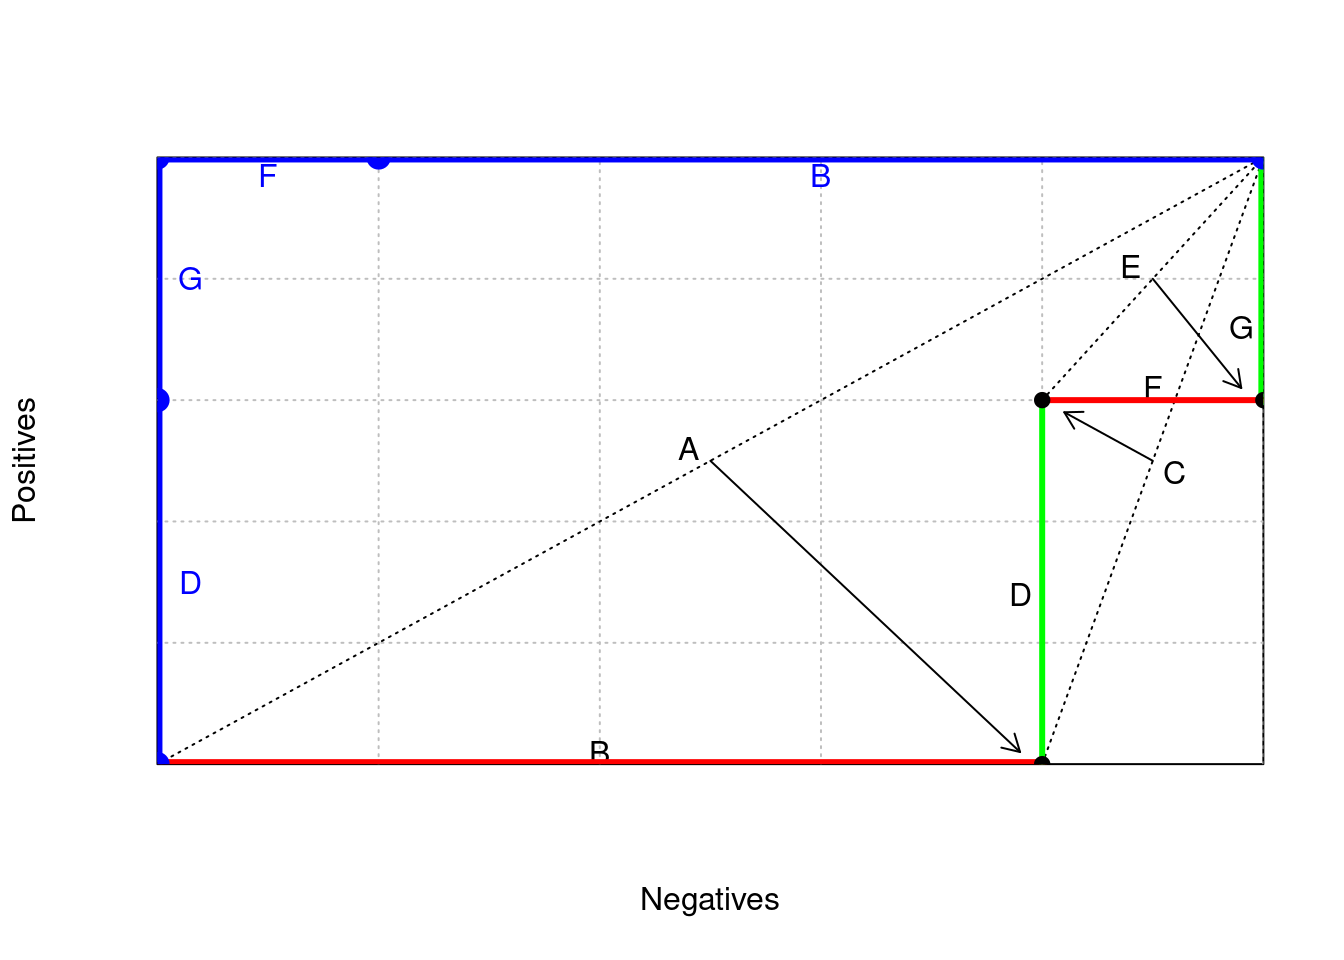
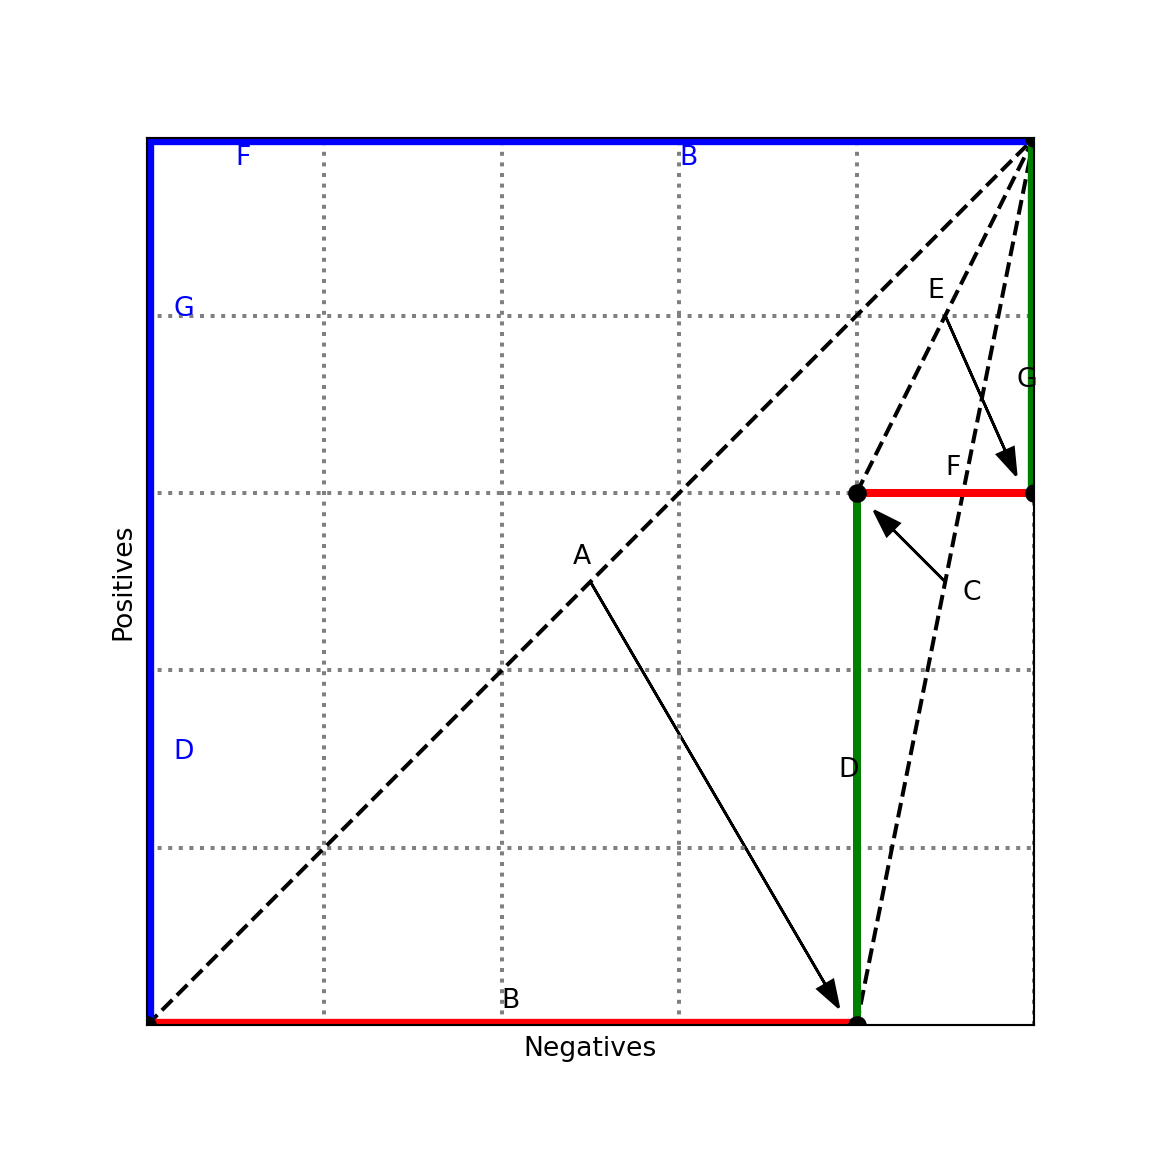
x <- c(0,400,400,500,500)
y <- c(0,  0,300,300,500)

h <- 500
w <- 500

grid.step <- 100


plot( c(0,w), c(0,h),
     xaxs = "i",yaxs = "i",
     xaxt = 'n', yaxt = 'n',
     type = "n",
     xlab = "Negatives", ylab = "Positives")


gx <- grid.step
while (gx <= w) {
  abline(v = gx, col="gray", lty="dotted")
  gx <- gx + grid.step
}
gy <- grid.step
while (gy <= h) {
  abline(h = gy, col="gray", lty="dotted")
  gy <- gy + grid.step
}

plotsplit <- function(l,r,m,labels,oo,pp,qq) {
    segments(x[l],y[l],x[r],y[r],lty=3,col="black")
    text( (x[l]+x[r])/2+oo[1], (y[l]+y[r])/2+oo[2], labels[1])
    text( (x[l]+x[m])/2+pp[1], (y[l]+y[m])/2+pp[2], labels[2])
    text( (x[m]+x[r])/2+qq[1], (y[m]+y[r])/2+qq[2], labels[3])
    arrows( (x[l]+x[r])/2, (y[l]+y[r])/2, x[m]+oo[1], y[m]+pp[2], code=2, length=0.1 )
}

plotsplit(1,5,2,c("A","B","C"),c(-10,10),c(0,10),c(10,-10))
plotsplit(2,5,3,c("","D","E"),c(10,-10),c(-10,-10),c(-10,10))
plotsplit(3,5,4,c("","F","G"),c(-10,-10),c(0,10),c(-10,-40))

lines( x[1:2], y[1:2], lwd=5, col='red')
lines( x[2:3], y[2:3], lwd=3, col='green')
lines( x[3:4], y[3:4], lwd=3, col='red')
lines( x[4:5], y[4:5], lwd=5, col='green')
points(x,y,pch=19,col='black')

lines( c(0,  0,  0,100,500), c(0,300,500,500,500), lwd=5, type='o',col='blue')

text(  15, 150, col="blue", "D")
text(  15, 400, col="blue", "G")
text(  50, 485, col="blue", "F")
text( 300, 485, col="blue", "B")