ax.set_xlabel("Negatives")
ax.set_ylabel("Positives")
gx = grid_step
while gx <= w:
ax.axvline(gx, color="gray", linestyle="dotted")
gx += grid_step
gy = grid_step
while gy <= h:
ax.axhline(gy, color="gray", linestyle="dotted")
gy += grid_step
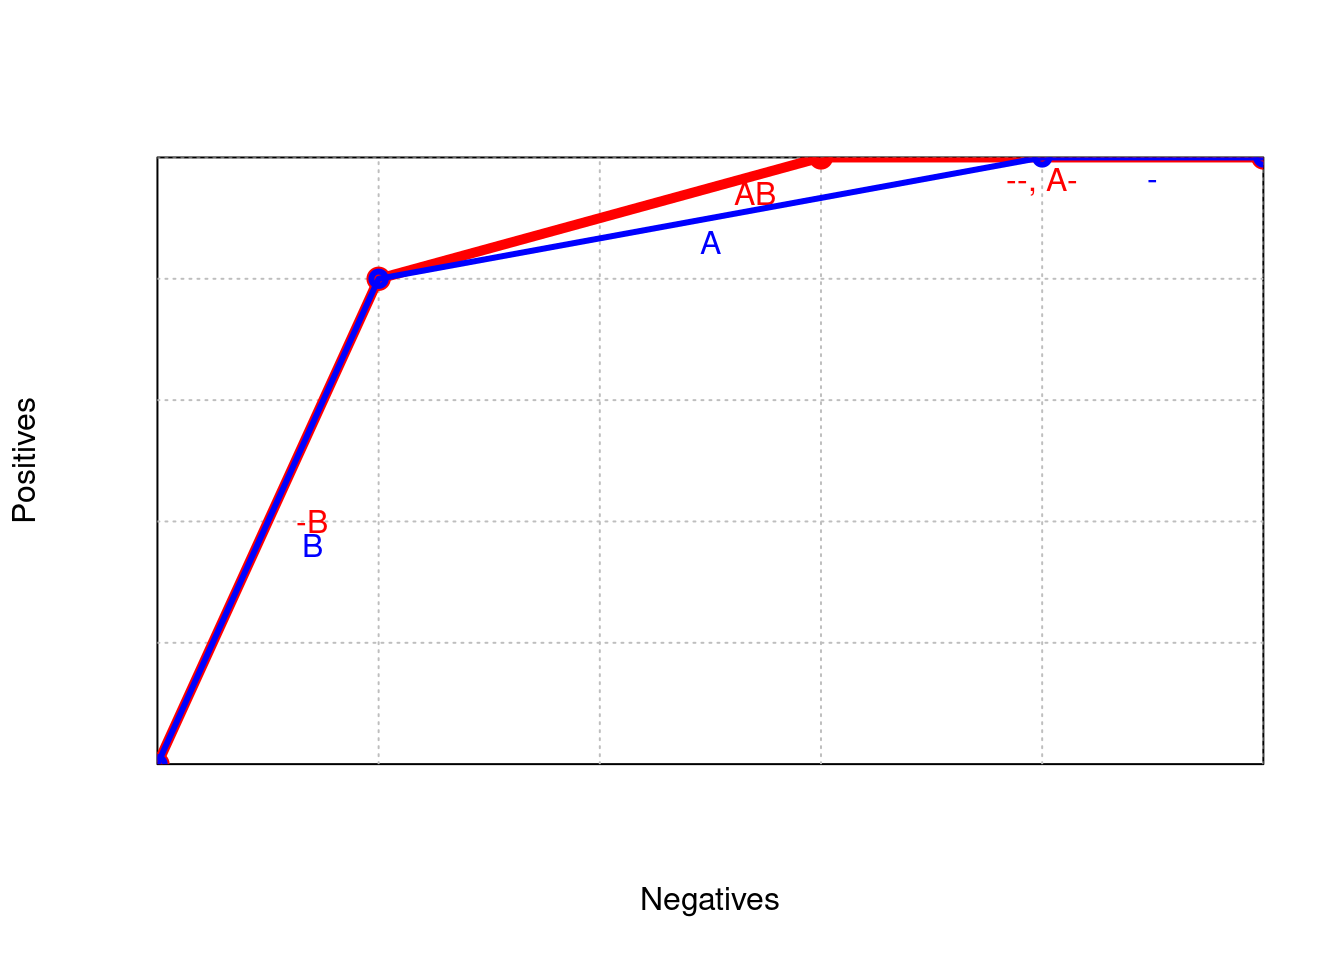
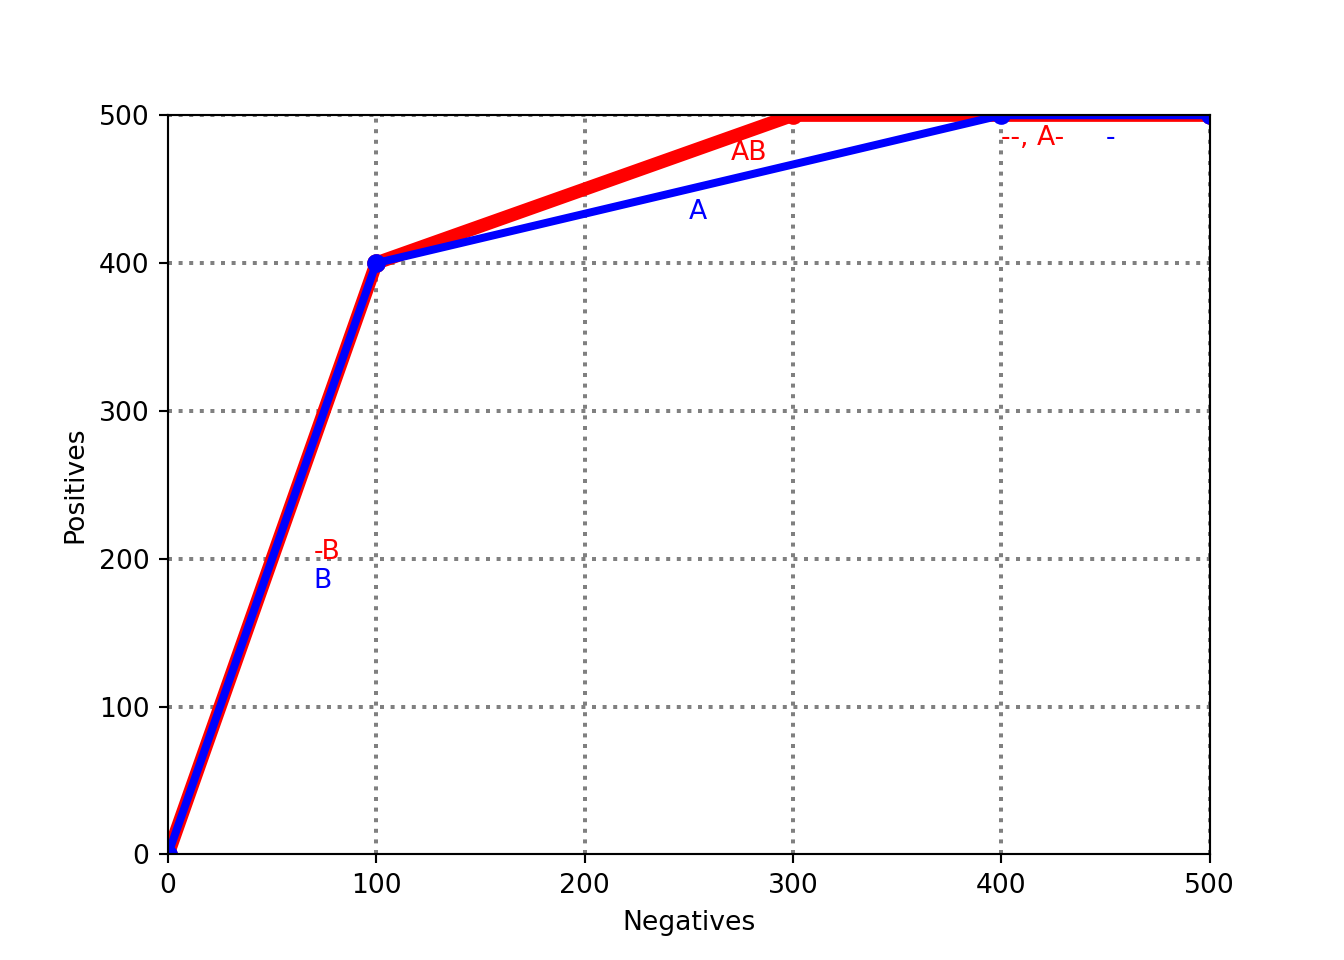
x = [0, 100, 300, 500]
y = [0, 400, 500, 500]
col = "red"
ax.plot(x, y, linewidth=5, marker='o', color=col)
ax.text((x[0] + x[1])/2 + 20, (y[0] + y[1])/2, "-B", color=col)
ax.text((x[1] + x[2])/2 + 70, (y[1] + y[2])/2 + 20, "AB", color=col)
ax.text((x[2] + x[3])/2, (y[2] + y[3])/2 - 20, "--, A-", color=col)
a = [0, 100, 400, 500]
b = [0, 400, 500, 500]
col = "blue"
ax.plot(a, b, linewidth=3, marker='o', color=col)
ax.text((a[0] + a[1])/2 + 20, (b[0] + b[1])/2 - 20, "B", color=col)
ax.text((a[1] + a[2])/2, (b[1] + b[2])/2 - 20, "A", color=col)
ax.text((a[2] + a[3])/2, (b[2] + b[3])/2 - 20, "-", color=col)
plt.show()