h <- 500
w <- 500
grid.step <- 100
plot( c(0,w), c(0,h),
xaxs = "i",yaxs = "i",
xaxt = "n", yaxt = "n",
type = "n",
xlab = "Negatives", ylab = "Positives")
gx <- grid.step
while (gx <= w) {
abline(v = gx, col="gray", lty="dotted")
gx <- gx + grid.step
}
gy <- grid.step
while (gy <= h) {
abline(h = gy, col="gray", lty="dotted")
gy <- gy + grid.step
}
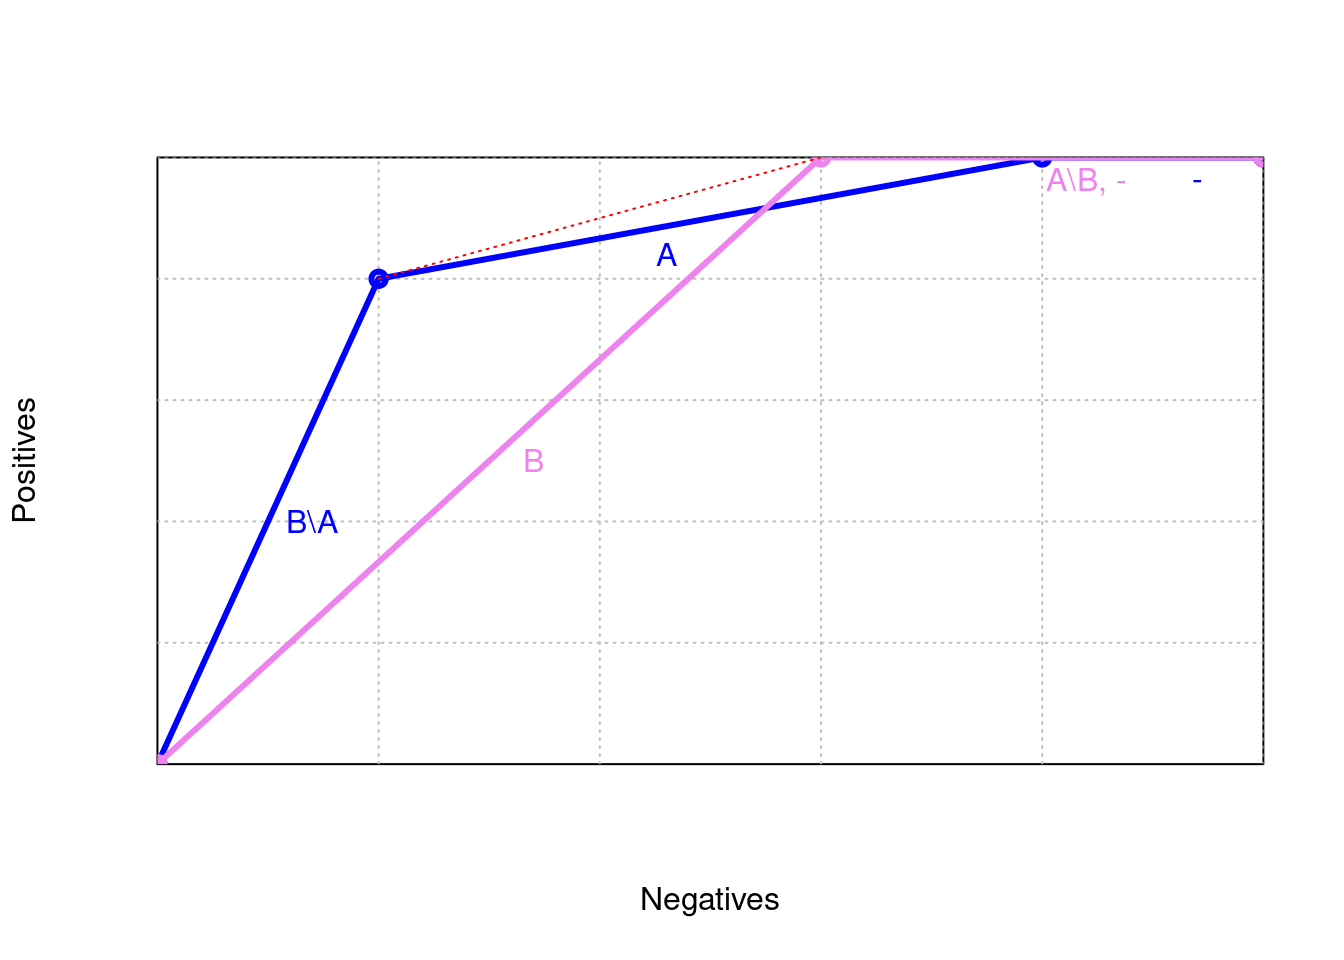
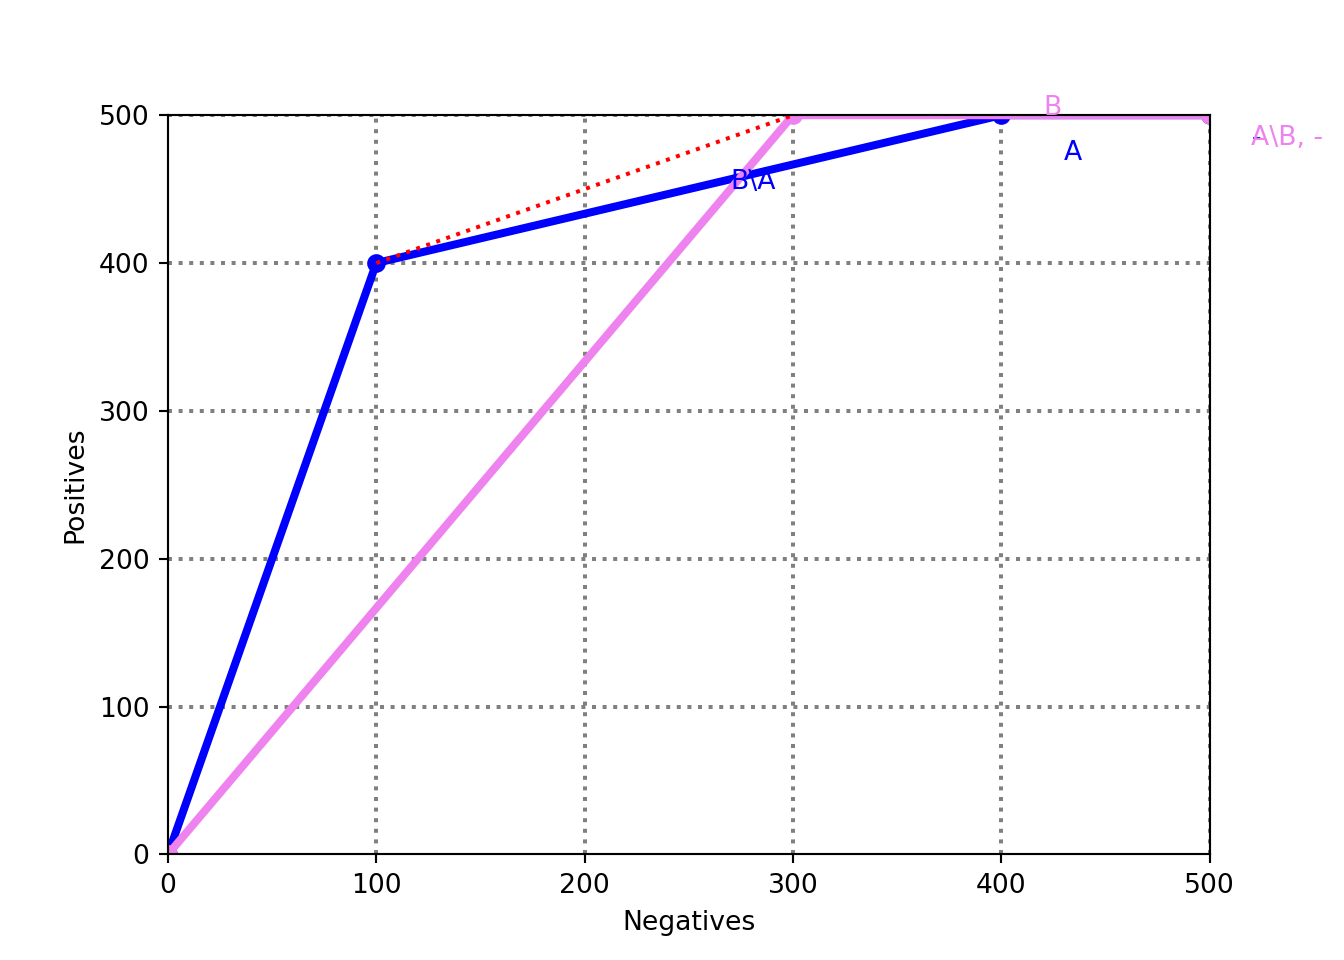
a <- c(0,100,400,500)
b <- c(0,400,500,500)
col <- "blue"
lines( a, b, lwd=3, type="o",col=col)
text( (a[1]+a[2])/2+20, (b[1]+b[2])/2, "B\\A",col=col)
text( (a[2]+a[3])/2-20, (b[2]+b[3])/2-30, "A",col=col)
text( (a[3]+a[4])/2+20, (b[3]+b[4])/2-20, "-",col=col)
a <- c(0,300,500)
b <- c(0,500,500)
col <- "violet"
lines( a, b, lwd=3, type="o",col=col)
text( (a[1]+a[2])/2+20, (b[1]+b[2])/2, "B",col=col)
text( (a[2]+a[3])/2+20, (b[2]+b[3])/2-20, "A\\B, -",col=col)
x <- c(0,100,300,500)
y <- c(0,400,500,500)
col <- "red"
lines( x[2:3], y[2:3], lty="dotted",col=col)
text( (x[2]+x[3])/2-15, (y[2]+y[3])/2+15, "",col=col)