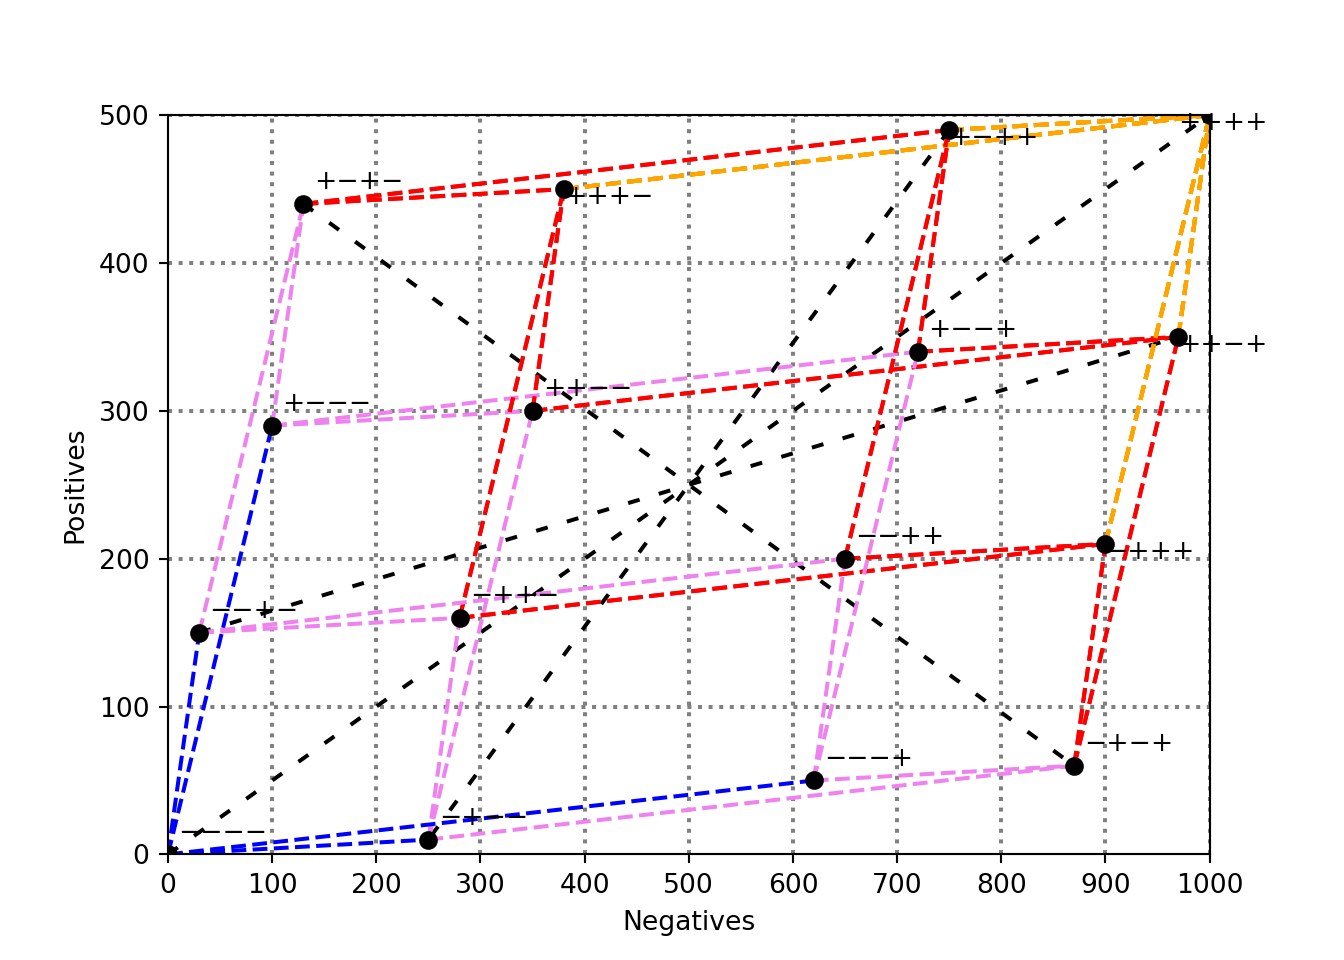
ax.set_xlabel("Negatives")
ax.set_ylabel("Positives")
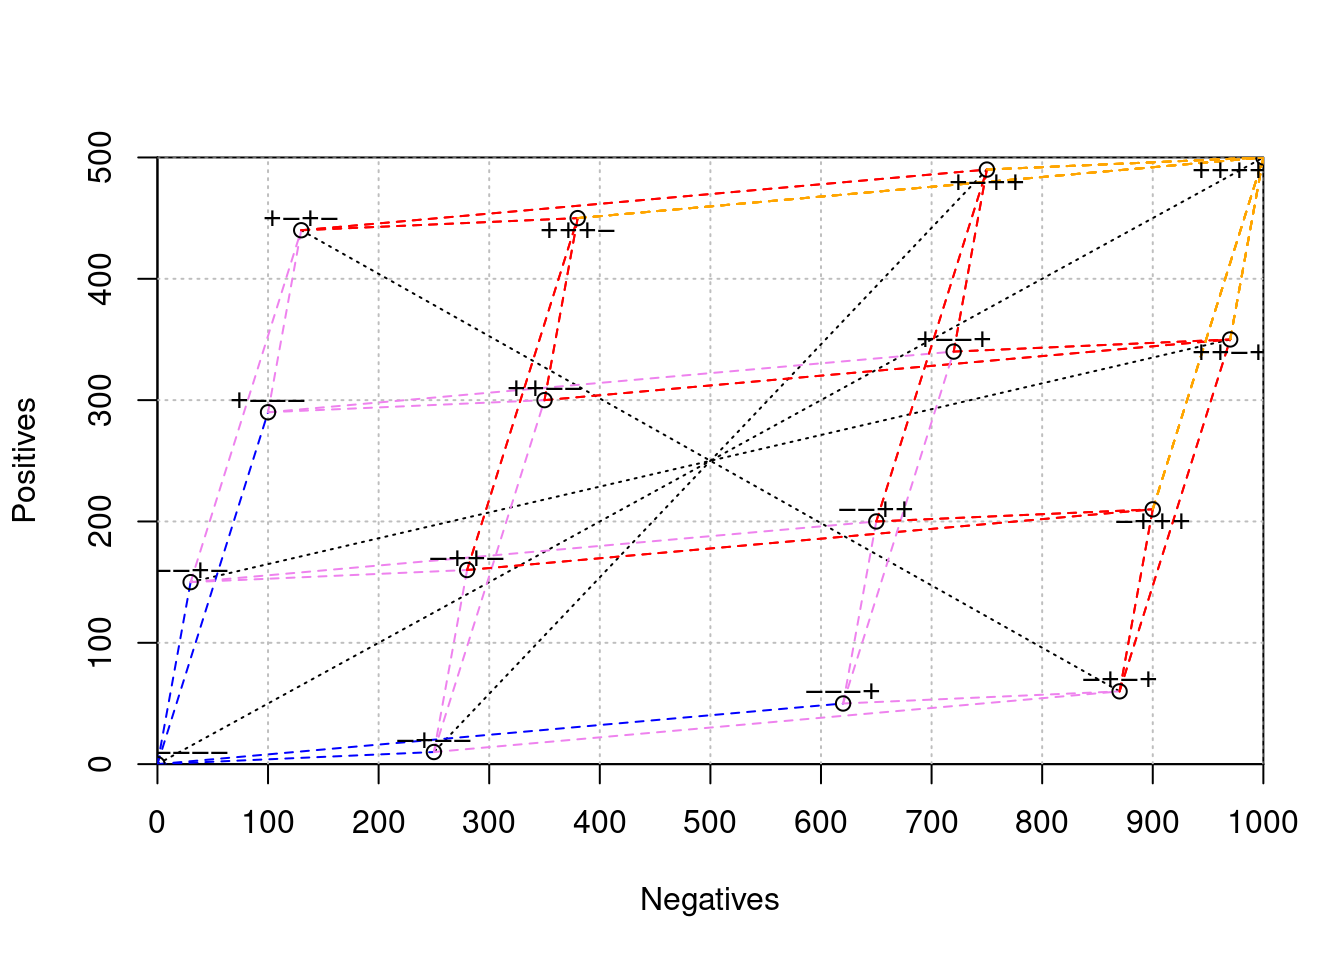
x = [100, 250, 30, 620]
y = [290, 10, 150, 50]
ax.set_xticks(range(0, w + 1, grid_step))
ax.set_yticks(range(0, h + 1, grid_step))
ax.set_xticklabels(range(0, w + 1, grid_step))
ax.set_yticklabels(range(0, h + 1, grid_step))
for gx in range(grid_step, w + 1, grid_step):
ax.axvline(gx, color='gray', linestyle='dotted')
for gy in range(grid_step, h + 1, grid_step):
ax.axhline(gy, color='gray', linestyle='dotted')
ax.plot([0, w], [0, h], linestyle=(0, (3, 5)), color='black') # linha tracejada tipo lty=3
def sum_coords(arr, indices):
return sum(arr[i] for i in indices)
ax.plot([x[2], sum_coords(x, [0,1,3])], [y[2], sum_coords(y, [0,1,3])], linestyle=(0, (3,5)), color='black')
ax.plot([sum_coords(x, [0,2]), sum_coords(x, [1,3])], [sum_coords(y, [0,2]), sum_coords(y, [1,3])], linestyle=(0, (3,5)), color='black')
ax.plot([sum_coords(x, [0,2,3]), x[1]], [sum_coords(y, [0,2,3]), y[1]], linestyle=(0, (3,5)), color='black')
for i in range(4):
ax.plot([0, x[i]], [0, y[i]], linestyle='dashed', color='blue')
for j in range(4):
if j != i:
ax.plot([x[i], x[i] + x[j]], [y[i], y[i] + y[j]], linestyle='dashed', color='violet')
for k in range(4):
if k != i and k != j:
ax.plot([x[i] + x[j], x[i] + x[j] + x[k]], [y[i] + y[j], y[i] + y[j] + y[k]], linestyle='dashed', color='red')
for l in range(4):
if l != i and l != j and l != k:
ax.plot([x[i] + x[j] + x[k], w], [y[i] + y[j] + y[k], h], linestyle='dashed', color='orange')
points_labels = [
(0, 0, "−−−−"),
(x[0], y[0], "+−−−"),
(x[1], y[1], "−+−−"),
(x[2], y[2], "−−+−"),
(x[3], y[3], "−−−+"),
(x[0] + x[1], y[0] + y[1], "++−−"),
(x[0] + x[2], y[0] + y[2], "+−+−"),
(x[0] + x[3], y[0] + y[3], "+−−+"),
(x[1] + x[2], y[1] + y[2], "−++−"),
(x[1] + x[3], y[1] + y[3], "−+−+"),
(x[2] + x[3], y[2] + y[3], "−−++"),
(x[0] + x[1] + x[2], y[0] + y[1] + y[2], "+++−"),
(x[0] + x[1] + x[3], y[0] + y[1] + y[3], "++−+"),
(x[0] + x[2] + x[3], y[0] + y[2] + y[3], "+−++"),
(x[1] + x[2] + x[3], y[1] + y[2] + y[3], "−+++"),
(w, h, "++++")
]
for (px, py, label) in points_labels:
ax.plot(px, py, marker='o', color='black')
if label == "++++":
ax.text(px - 30, py - 10, label)
elif label in ["+++−", "++−+", "+−++", "−+++"]:
ax.text(px, py - 10, label)
else:
ax.text(px + 10, py + 10, label)
plt.show()