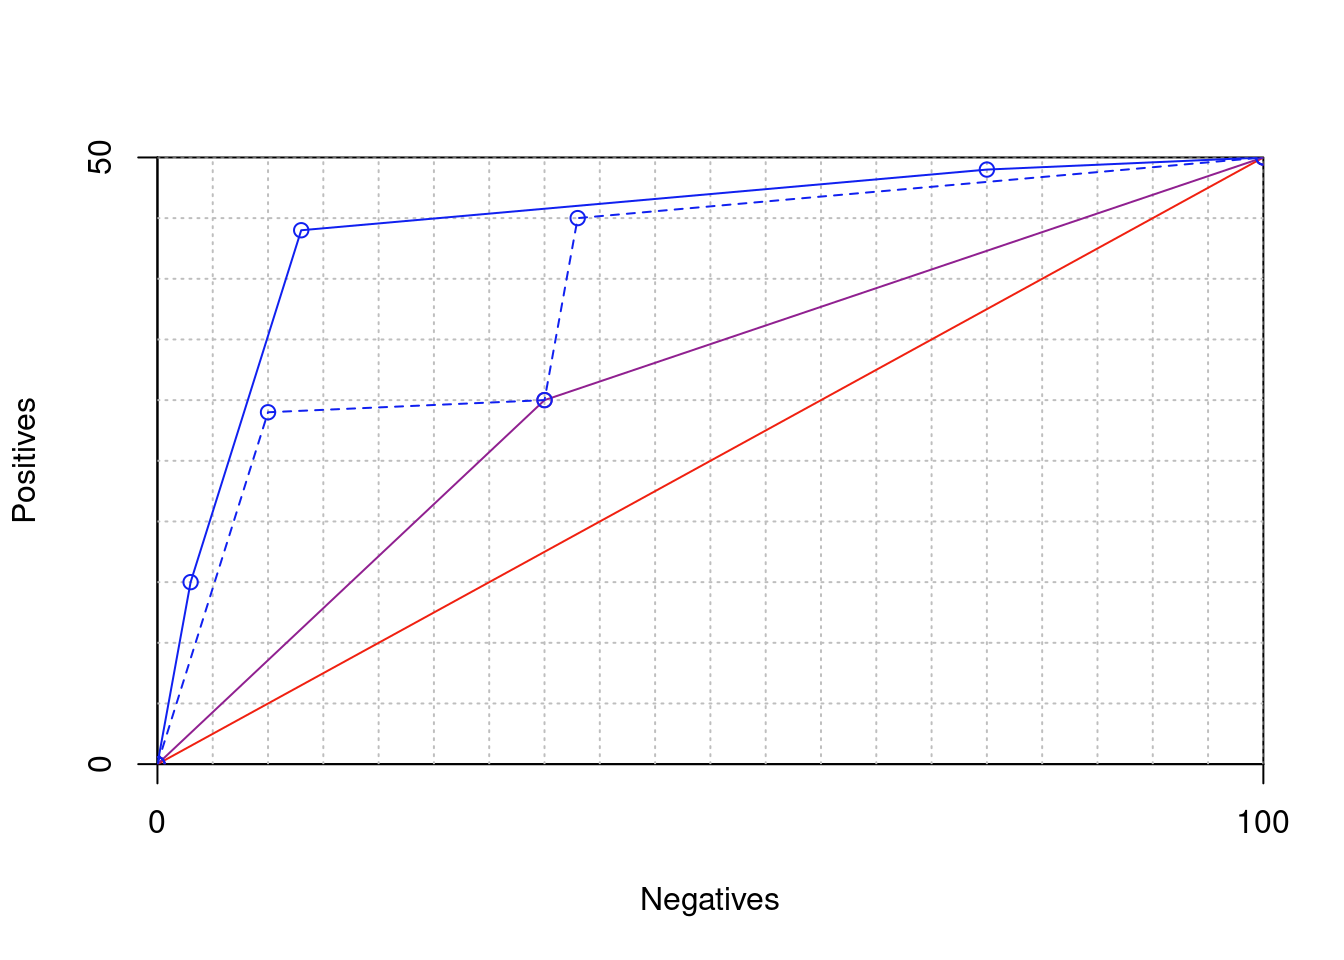
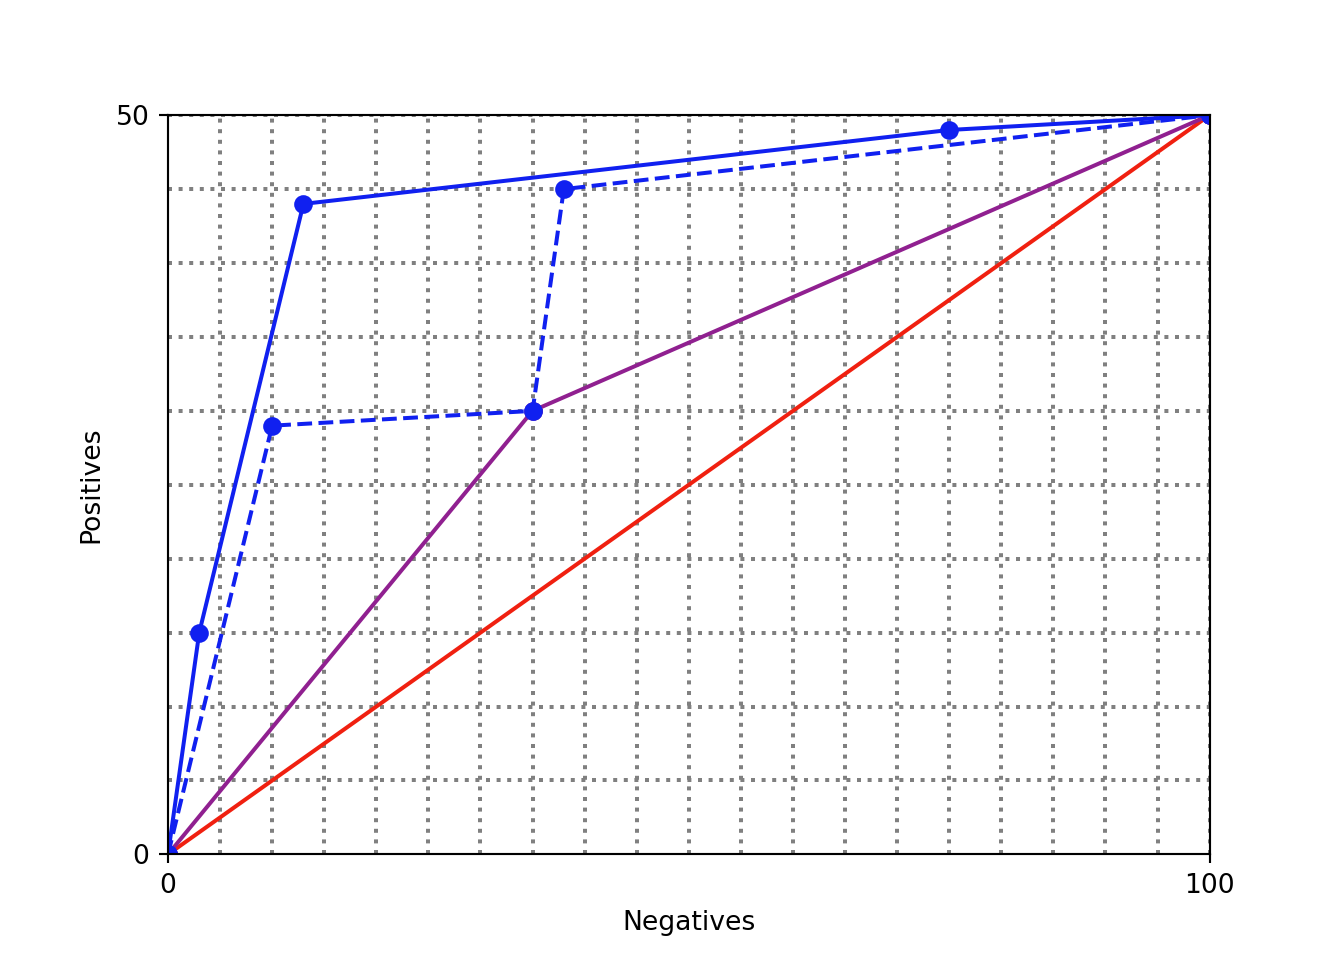
5.4 Grow Tree

Grow Tree right

R figure

Code
h <- 500 
w <- 1000 

grid.step <- 50

plot( c(0,w), c(0,h),  
     xaxs = "i",yaxs = "i",
     xaxt = 'n', yaxt = 'n',
     type = "n",
     xlab = "Negatives", ylab = "Positives")

p0 <- 500
n0 <- 1000
p1 <- 300
n1 <- 350
p
Error: object 'p' not found
Code
y0 <- c(0,  p0)
x0 <- c(0,  n0)
y1 <- c(0,  p1,  p0)
x1 <- c(0,  n1,  n0)
y3 <- c(0,  290,  p1,  450,  p0)
x3 <- c(0,  100,  n1,  380,  n0)
y4 <- c(0,  150,  440,  490,  p0)
x4 <- c(0,   30,  130,  750,  n0)

axis(2,y0,labels=c('0','50'))
axis(1,x0,labels=c('0','100'))

gx <- grid.step
while (gx <= w) {
  abline(v = gx, col="gray", lty="dotted")
  gx <- gx + grid.step
}
gy <- grid.step
while (gy <= h) {
  abline(h = gy, col="gray", lty="dotted")
  gy <- gy + grid.step
}


lines( x0, y0, lty=1, type='o', col=rgb(240,32, 16,maxColorValue=255))
lines( x1, y1, lty=1, type='o', col=rgb(144,32,144,maxColorValue=255))
lines( x3, y3, lty=2, type='o', col=rgb( 16,32,240,maxColorValue=255))
lines( x4, y4, lty=1, type='o', col=rgb( 16,32,240,maxColorValue=255))

Python figure

Code
import matplotlib.pyplot as plt

h = 500
w = 1000
grid_step = 50

fig, ax = plt.subplots()
ax.set_xlim(0, w)
(0.0, 1000.0)
Code
ax.set_ylim(0, h)
(0.0, 500.0)
Code
ax.set_xlabel("Negatives")
ax.set_ylabel("Positives")
ax.set_xticks([])
[]
Code
ax.set_yticks([])
[]
Code
p0 = 500
n0 = 1000
p1 = 300
n1 = 350

y0 = [0, p0]
x0 = [0, n0]
y1 = [0, p1, p0]
x1 = [0, n1, n0]
y3 = [0, 290, p1, 450, p0]
x3 = [0, 100, n1, 380, n0]
y4 = [0, 150, 440, 490, p0]
x4 = [0, 30, 130, 750, n0]

ax.set_yticks(y0)
ax.set_yticklabels(['0', '50'])
ax.set_xticks(x0)
ax.set_xticklabels(['0', '100'])

gx = grid_step
while gx <= w:
    ax.axvline(gx, color='gray', linestyle='dotted')
    gx += grid_step

gy = grid_step
while gy <= h:
    ax.axhline(gy, color='gray', linestyle='dotted')
    gy += grid_step

def rgb(r, g, b):
    return (r/255, g/255, b/255)

ax.plot(x0, y0, linestyle='-', marker='o', color=rgb(240, 32, 16))
ax.plot(x1, y1, linestyle='-', marker='o', color=rgb(144, 32, 144))
ax.plot(x3, y3, linestyle='--', marker='o', color=rgb(16, 32, 240))
ax.plot(x4, y4, linestyle='-', marker='o', color=rgb(16, 32, 240))

plt.show()

Grow Tree left

Code
graph TD;
    N0["[50+, 100−]"]:::red
    N11["[30+, 35−]"]:::purple
    N12["[20+, 65−]"]:::purple
    N21["[29+, 10−]"]:::blue
    N22["[1+, 25−]"]:::blue
    N31["[15+, 3−]"]:::blue
    N32["[5+, 62−]"]:::blue

    N0 -- "(1)" --> N11
    N0 --> N12
    N11 -- "(2)" --> N21
    N11 --> N22
    N12 -- "(3)" --> N31
    N12 --> N32

    classDef red fill:#f04030,stroke:#000,stroke-width:1px;
    classDef purple fill:#804080,stroke:#000,stroke-width:1px;
    classDef blue fill:#1040f0,stroke:#000,stroke-width:1px;