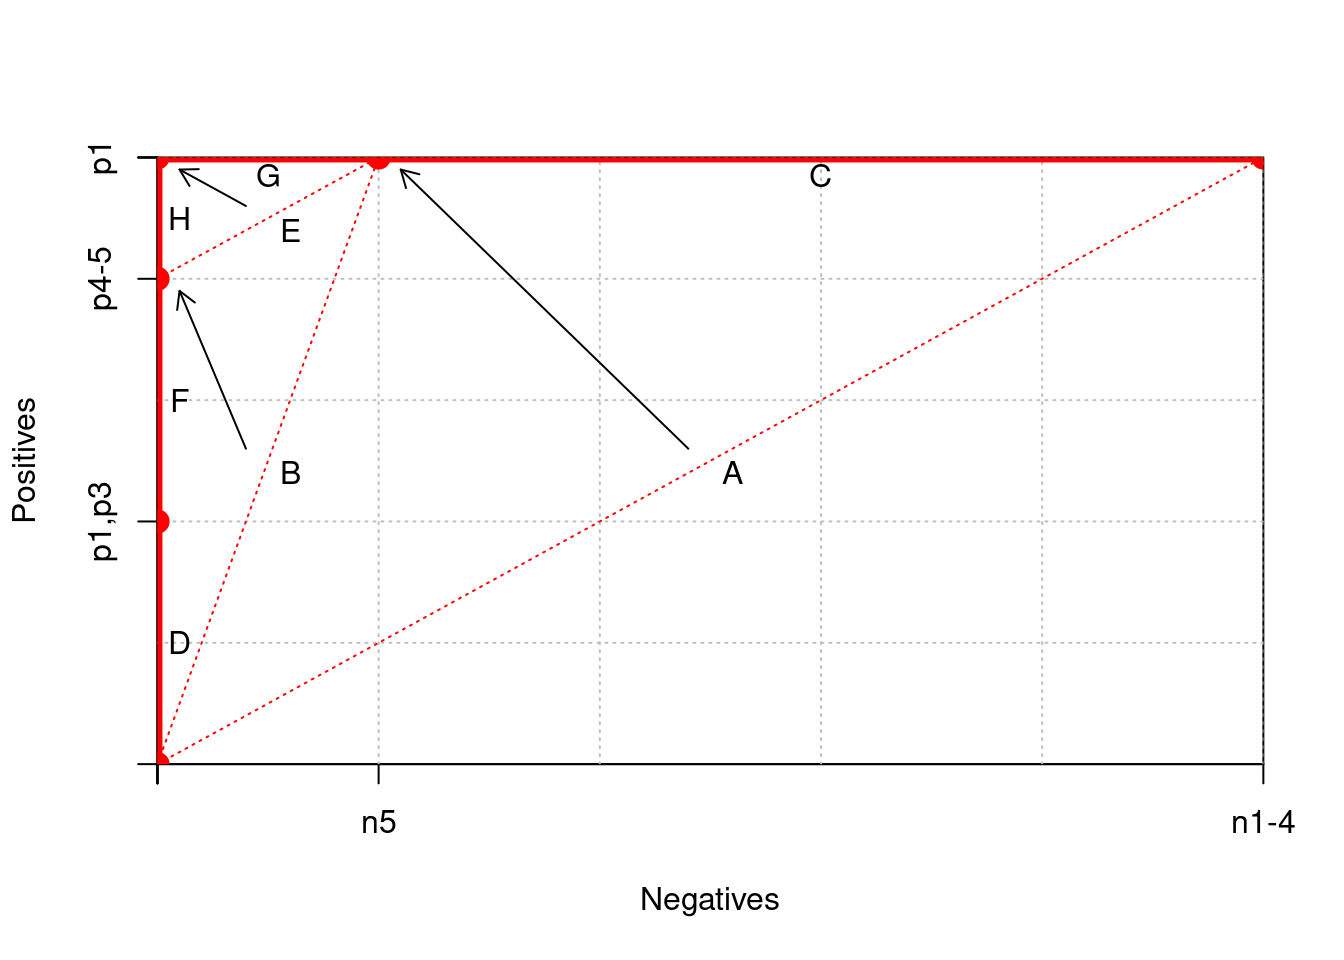
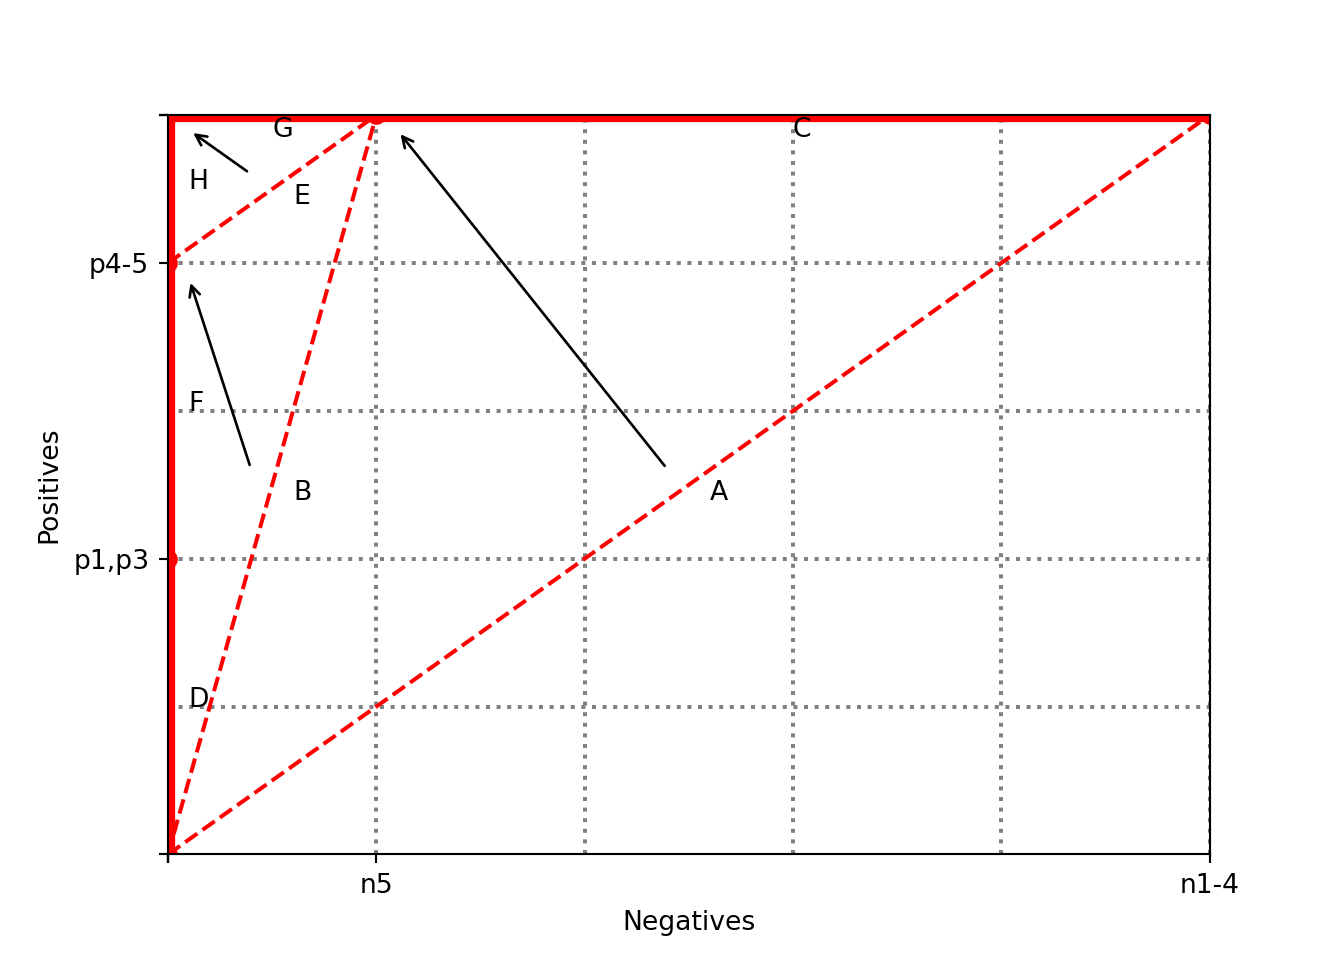
ax.set_xticks(x)
ax.set_xticklabels(['', '', '', '', 'n5', 'n1-4'])
ax.set_yticks(y)
ax.set_yticklabels(['', 'p1,p3', 'p4-5', 'p1', '', ''])

gx = grid_step
while gx <= w:
    ax.axvline(x=gx, color='gray', linestyle='dotted')
    gx += grid_step

gy = grid_step
while gy <= h:
    ax.axhline(y=gy, color='gray', linestyle='dotted')
    gy += grid_step

ax.text((x[0] + x[5]) / 2 + 10, (y[0] + y[5]) / 2 - 10, "A")
ax.text((x[0] + x[4]) / 2 + 10, (y[0] + y[4]) / 2 - 10, "B")
ax.text((x[4] + x[5]) / 2, y[5] - 15, "C")
ax.text(x[1] + 10, (y[0] + y[1]) / 2, "D")
ax.text((x[2] + x[4]) / 2 + 10, (y[2] + y[4]) / 2 - 10, "E")
ax.text(x[2] + 10, (y[1] + y[2]) / 2, "F")
ax.text((x[3] + x[4]) / 2, y[4] - 15, "G")
ax.text(x[3] + 10, (y[2] + y[3]) / 2, "H")

ax.annotate('', xy=(x[4] + 10, y[4] - 10), xytext=((x[0] + x[5]) / 2 - 10, (y[0] + y[5]) / 2 + 10),
            arrowprops=dict(arrowstyle='->'))
ax.annotate('', xy=(x[2] + 10, y[2] - 10), xytext=((x[0] + x[4]) / 2 - 10, (y[0] + y[4]) / 2 + 10),
            arrowprops=dict(arrowstyle='->'))
ax.annotate('', xy=(x[3] + 10, y[3] - 10), xytext=((x[2] + x[4]) / 2 - 10, (y[2] + y[4]) / 2 + 10),
            arrowprops=dict(arrowstyle='->'))

ax.plot(x, y, linewidth=5, color='red', marker='o')

ax.plot([x[0], x[5]], [y[0], y[5]], linestyle='dashed', color='red')
ax.plot([x[0], x[4]], [y[0], y[4]], linestyle='dashed', color='red')
ax.plot([x[2], x[4]], [y[2], y[4]], linestyle='dashed', color='red')

ax.set_xlabel("Negatives")
ax.set_ylabel("Positives")

plt.show()