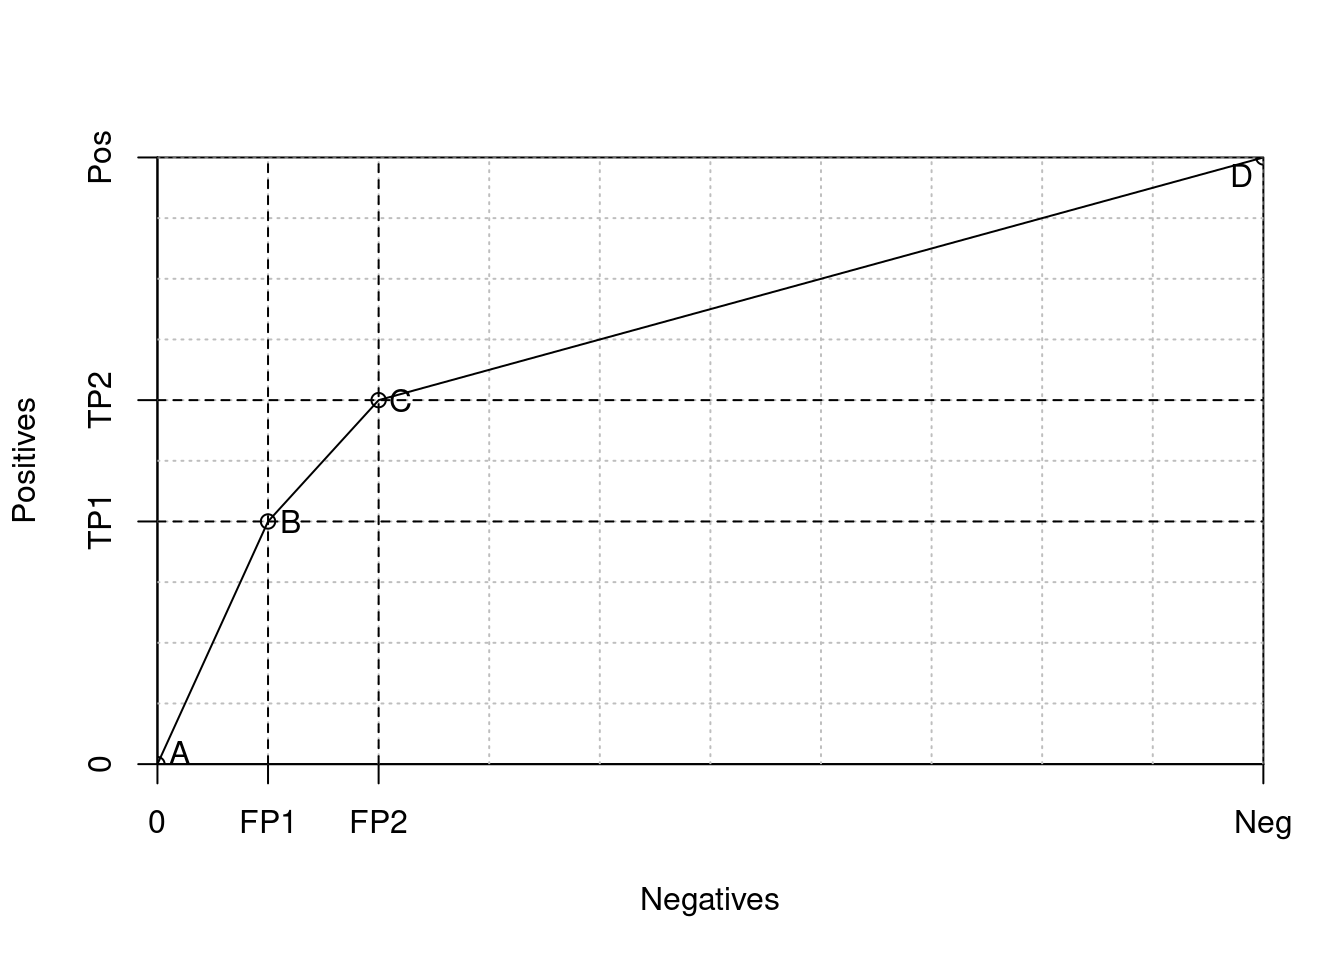
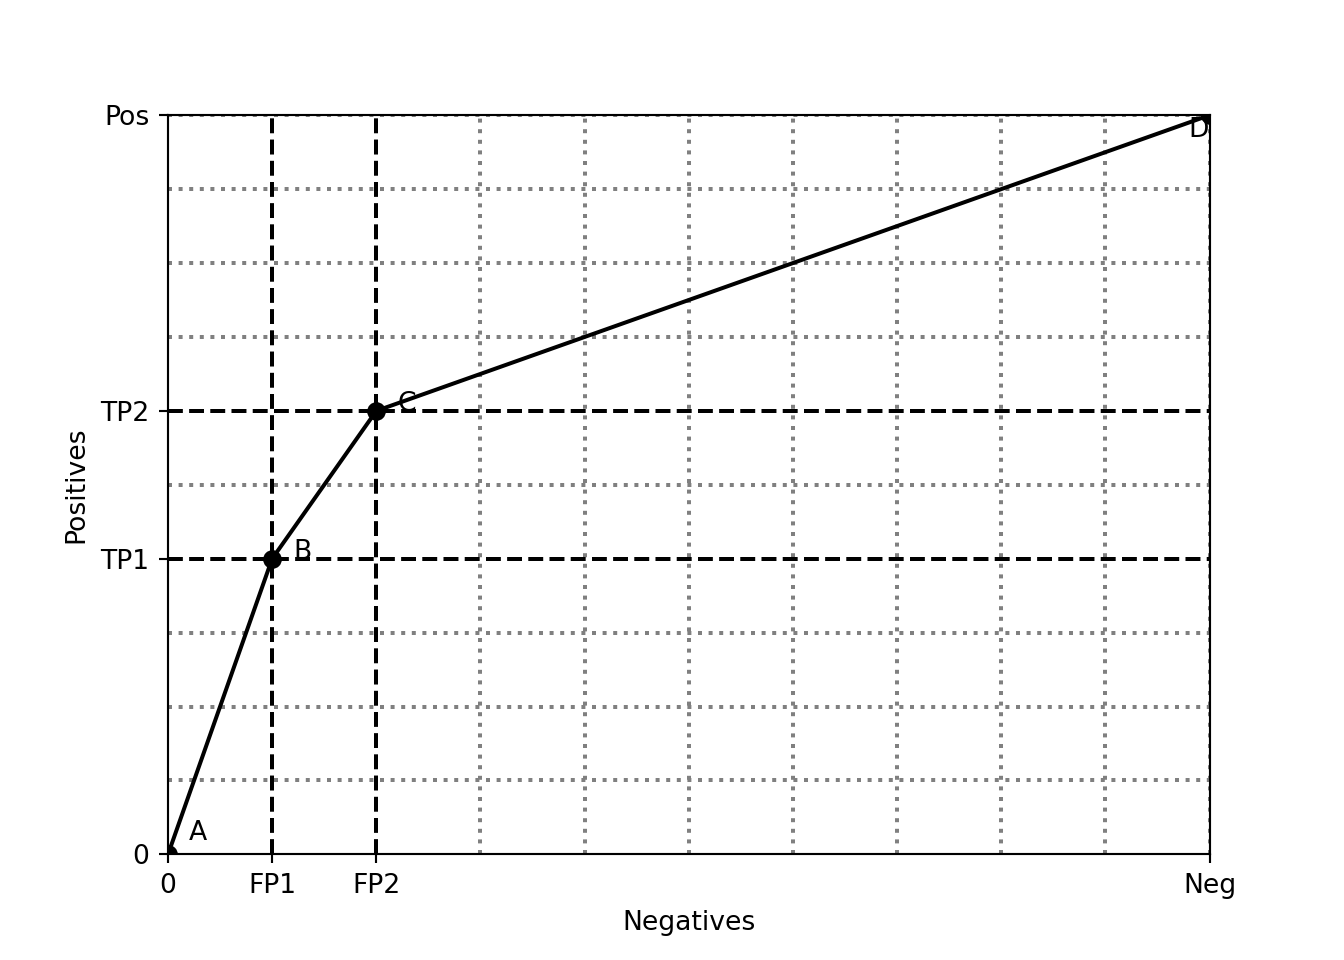
ax.set_xticks([0, 50, 100, 500])
ax.set_xticklabels(['0', 'FP1', 'FP2', 'Neg'])
ax.set_yticks([0, 200, 300, 500])
ax.set_yticklabels(['0', 'TP1', 'TP2', 'Pos'])

x = [0, 50, 100, 500]
y = [0, 200, 300, 500]

for gx in range(grid_step, w + 1, grid_step):
    ax.axvline(x=gx, linestyle='dotted', color='gray')
for gy in range(grid_step, h + 1, grid_step):
    ax.axhline(y=gy, linestyle='dotted', color='gray')

ax.text(x[0]+10, y[0]+10, "A")
ax.text(x[1]+10, y[1], "B")
ax.text(x[2]+10, y[2], "C")
ax.text(x[3]-10, y[3]-15, "D")

for i in [1, 2]:
    ax.axvline(x=x[i], linestyle='dashed', color='black')
    ax.axhline(y=y[i], linestyle='dashed', color='black')

ax.plot(x, y, linestyle='solid', marker='o', color='black')
ax.set_xlabel("Negatives")
ax.set_ylabel("Positives")
plt.show()