2.7 Covrank left

R figure

Code
h <- 500 
w <- 500 
grid.step <- 10


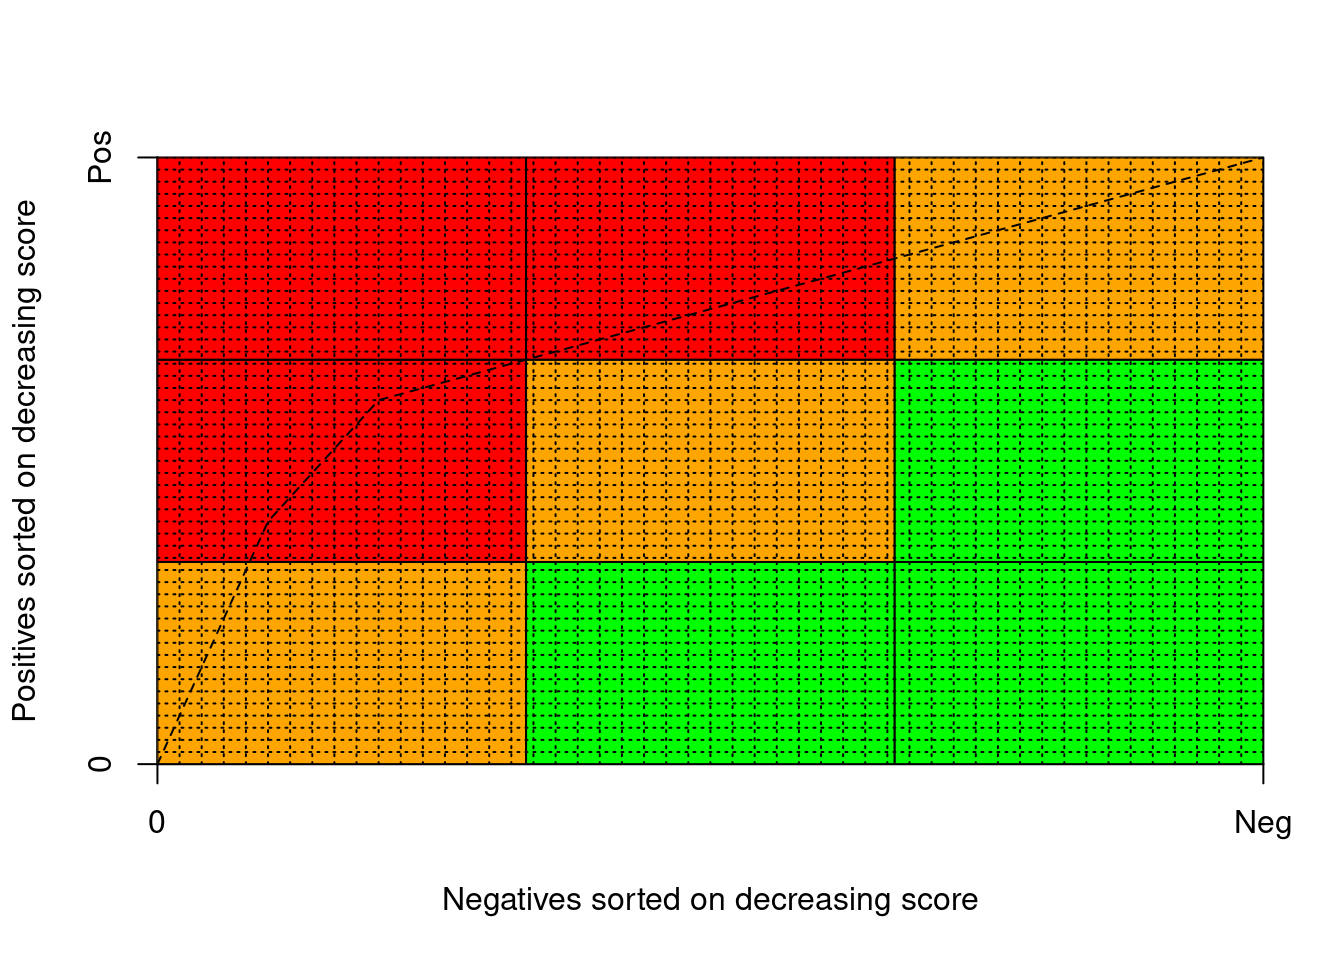
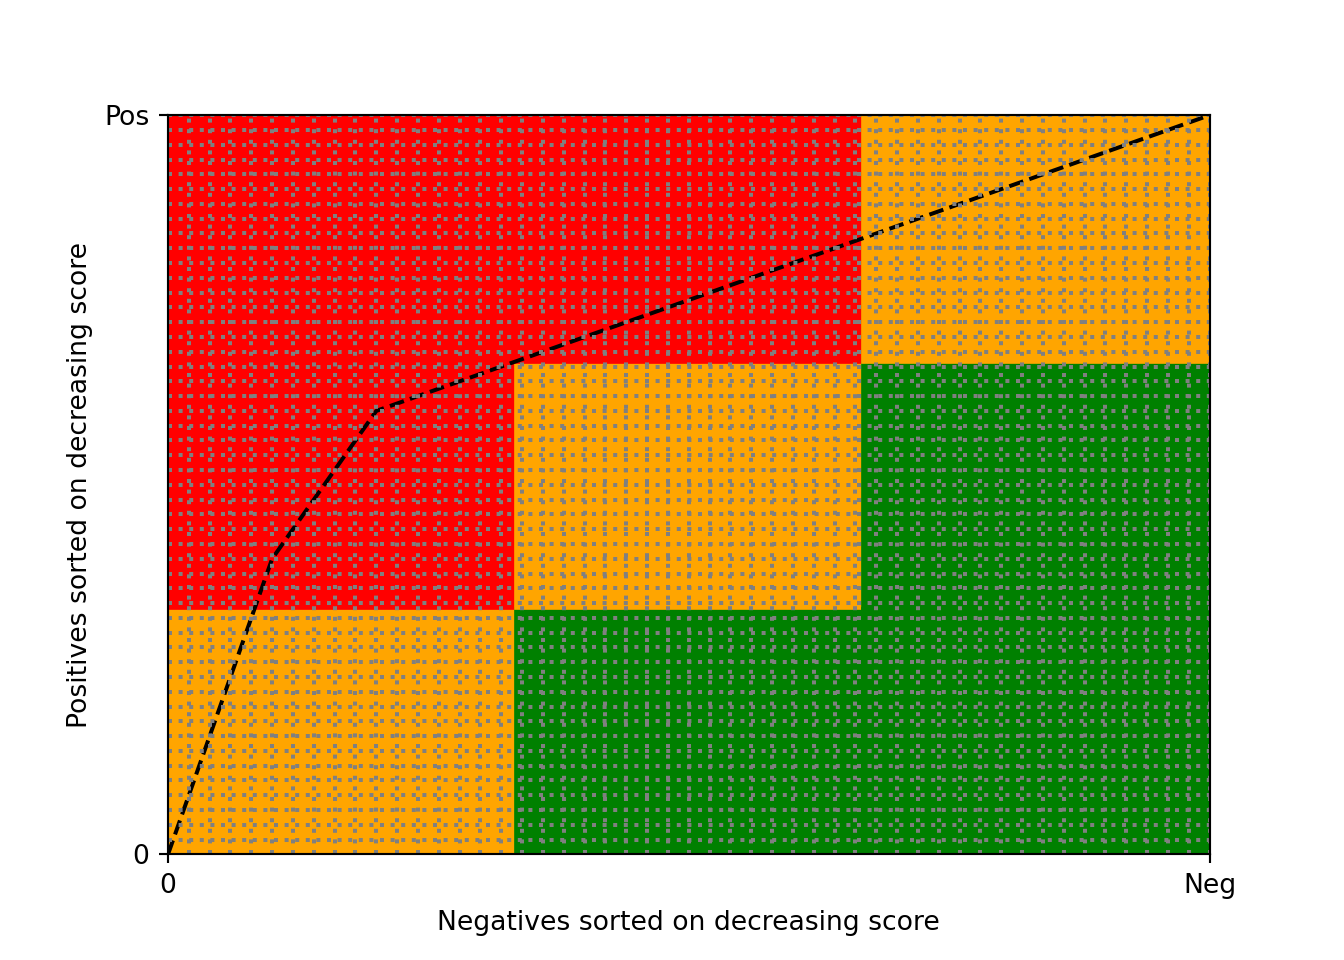
plot(c(0, w), c(0, h),  
     xaxs = "i", yaxs = "i",
     xaxt = 'n', yaxt = 'n',
     type = "n",
     xlab = "Negatives sorted on decreasing score", 
     ylab = "Positives sorted on decreasing score")

axis(2, c(0, h), labels = c('0', 'Pos'))
axis(1, c(0, w), labels = c('0', 'Neg'))

x <- seq(0, w, length.out = 4)  
y <- seq(0, h, length.out = 4)  

for (i in 1:3) {
  for (j in 1:3) {
    if (i < j) { col <- 'red' }
    if (i == j) { col <- 'orange' }
    if (i > j) { col <- 'green' }
    rect(x[i], y[j], x[i + 1], y[j + 1], col = col)
  }
}

x_curve <- c(0,  50,  100,  500)
y_curve <- c(0, 200,  300,  500)
lines(x_curve, y_curve, lty = 2)


gx <- grid.step
while (gx <= w) {
  abline(v = gx, lty = "dotted")
  gx <- gx + grid.step
}

gy <- grid.step
while (gy <= h) {
  abline(h = gy, lty = "dotted")
  gy <- gy + grid.step
}

Python figure

Code
import matplotlib.pyplot as plt

h = 500
w = 500
grid_step = 10

fig, ax = plt.subplots()
ax.set_xlim(0, w)
(0.0, 500.0)
Code
ax.set_ylim(0, h)
(0.0, 500.0)
Code
ax.set_xticks([0, w])
ax.set_xticklabels(['0', 'Neg'])
ax.set_yticks([0, h])
ax.set_yticklabels(['0', 'Pos'])

x = [0, w/3, 2*w/3, w]
y = [0, h/3, 2*h/3, h]

for i in range(3):
    for j in range(3):
        if i < j:
            color = 'red'
        elif i == j:
            color = 'orange'
        else:
            color = 'green'
        ax.add_patch(plt.Rectangle((x[i], y[j]), x[i+1]-x[i], y[j+1]-y[j], color=color))

x_curve = [0, 50, 100, 500]
y_curve = [0, 200, 300, 500]
ax.plot(x_curve, y_curve, linestyle='dashed', color='black')

for gx in range(grid_step, w + 1, grid_step):
    ax.axvline(x=gx, linestyle='dotted', color='gray')
for gy in range(grid_step, h + 1, grid_step):
    ax.axhline(y=gy, linestyle='dotted', color='gray')

ax.set_xlabel("Negatives sorted on decreasing score")
ax.set_ylabel("Positives sorted on decreasing score")
plt.show()