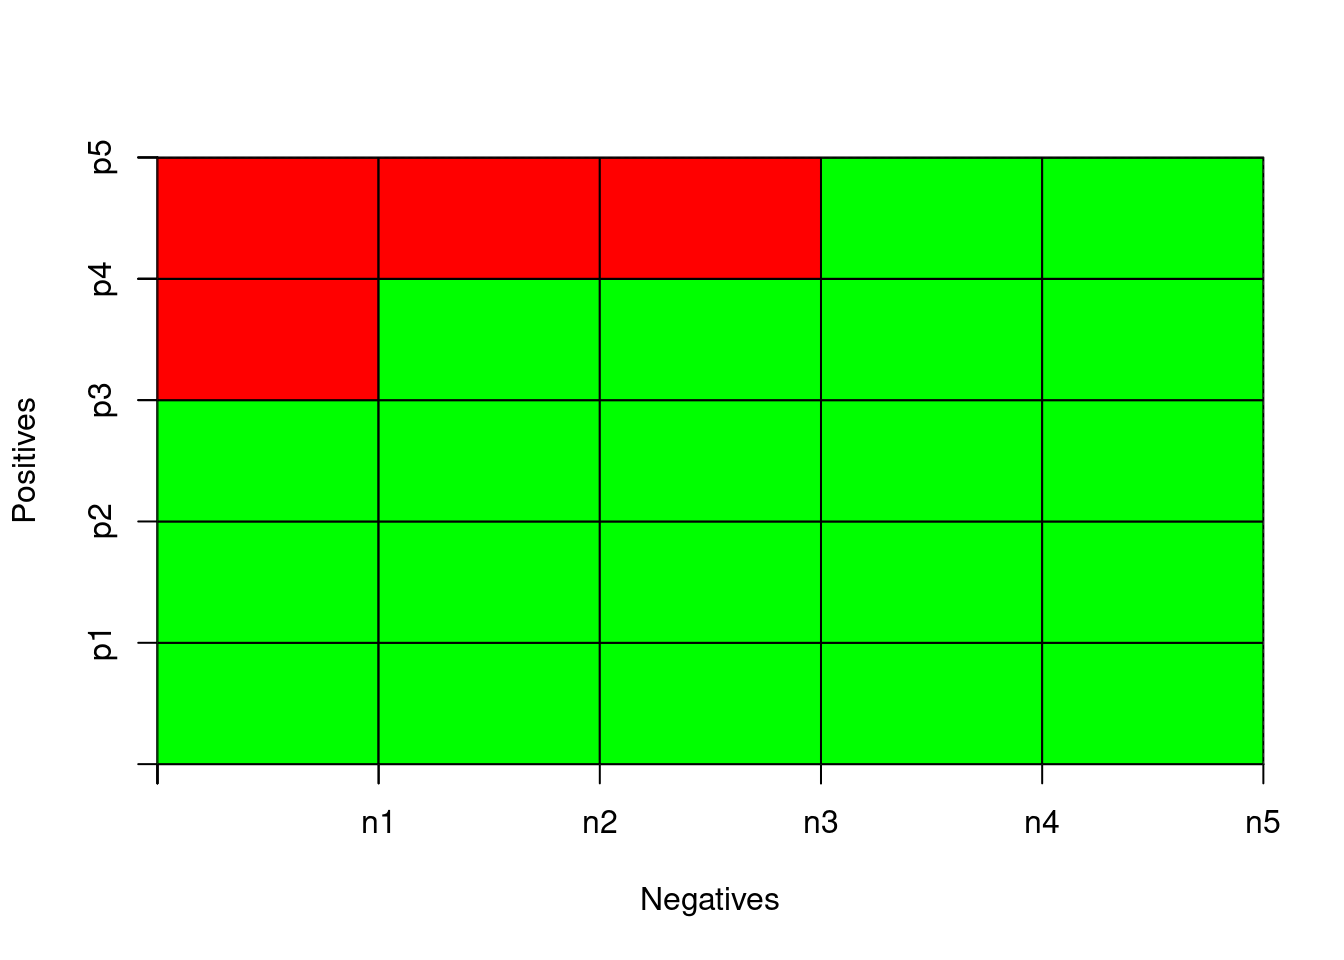
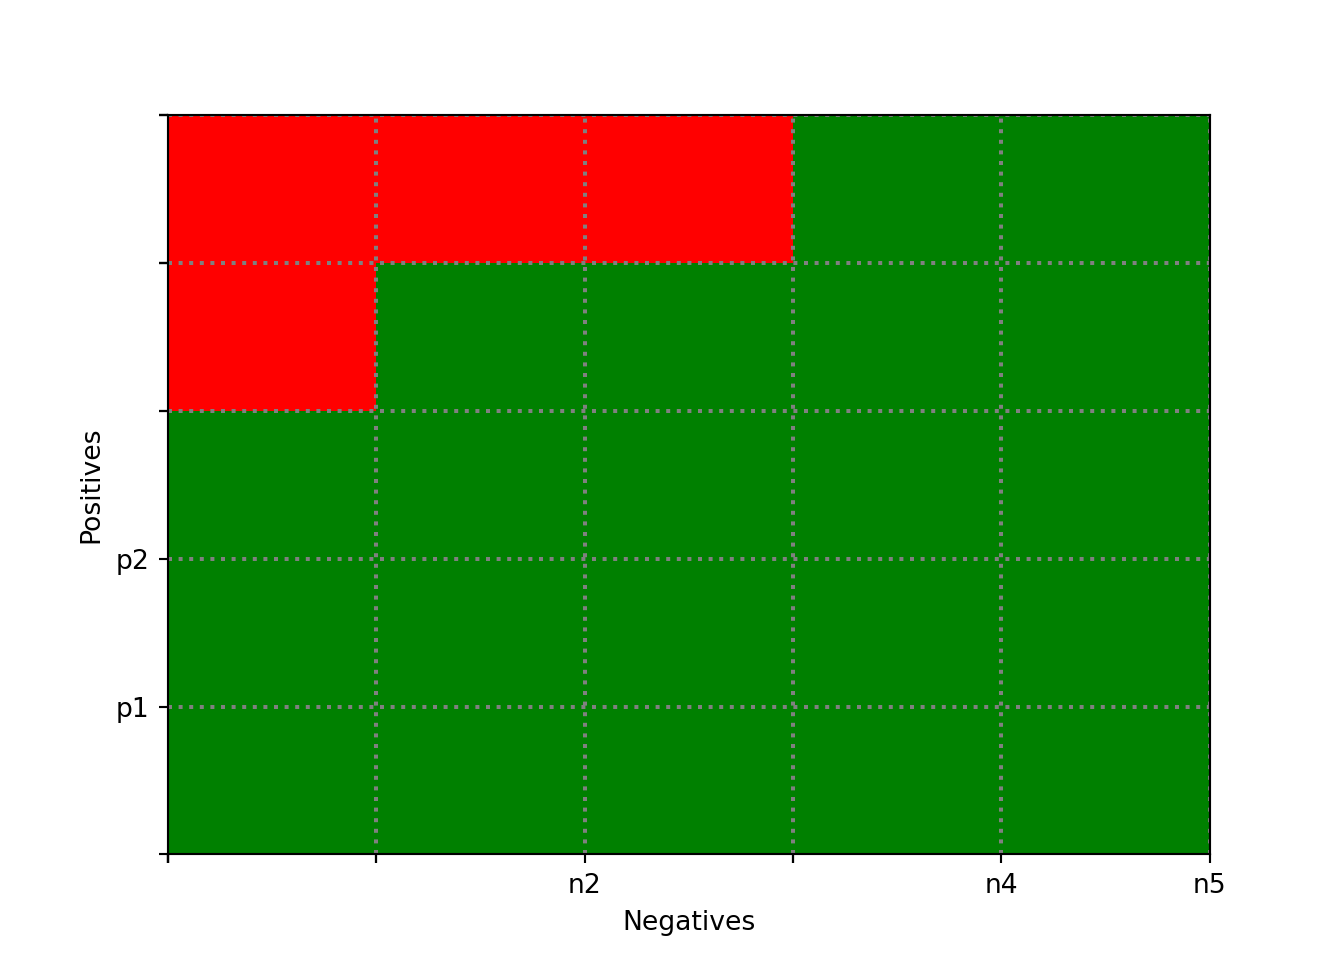
2.9 Covgrad right

R figure

Code
ranking <- c(1,1,1,0,1,0,0,1,0,0)
x <- c(0,0,0,0,100,100,200,300,300,400,500)
y <- c(0,100,200,300,300,400,400,400,500,500,500)

h <- 500 
w <- 500 

grid.step <- 100

plot( c(0,w), c(0,h),  
     xaxs = "i",yaxs = "i",
     xaxt = 'n', yaxt = 'n',
     type = "n",
     xlab = "Negatives", ylab = "Positives")
     
axis(2,y,labels=c('','p1','p2','p3','','p4','','','p5','',''))
axis(1,x,labels=c('','','','','n1','','n2','n3','','n4','n5'))

gx <- grid.step
while (gx <= w) {
  abline(v = gx, col="gray", lty="dotted")
  gx <- gx + grid.step
}
gy <- grid.step
while (gy <= h) {
  abline(h = gy, col="gray", lty="dotted")
  gy <- gy + grid.step
}

for (i in 1:11) {
    for (j in 1:11) {
        if (i<j) {col='red'}
        if (i==j) {col='orange'}
        if (i>j) {col='green'}
        rect(x[i],y[j],x[i+1],y[j+1],col=col)
        }
}

Python figure

Code
import matplotlib.pyplot as plt
import matplotlib.patches as patches

ranking = [1,1,1,0,1,0,0,1,0,0]
x = [0,0,0,0,100,100,200,300,300,400,500,500]
y = [0,100,200,300,300,400,400,400,500,500,500,500]

h = 500
w = 500
grid_step = 100

fig, ax = plt.subplots()
ax.set_xlim(0, w)
(0.0, 500.0)
Code
ax.set_ylim(0, h)
(0.0, 500.0)
Code
ax.set_xticks(x[:-1])
ax.set_xticklabels(['','','','','n1','','n2','n3','','n4','n5'])
ax.set_yticks(y[:-1])
ax.set_yticklabels(['','p1','p2','p3','','p4','','','p5','',''])

for gx in range(grid_step, w + 1, grid_step):
    ax.axvline(x=gx, color='gray', linestyle='dotted')
for gy in range(grid_step, h + 1, grid_step):
    ax.axhline(y=gy, color='gray', linestyle='dotted')

for i in range(11):
    for j in range(11):
        if i < j:
            color = 'red'
        elif i == j:
            color = 'orange'
        else:
            color = 'green'
        rect = patches.Rectangle((x[i], y[j]), x[i+1]-x[i], y[j+1]-y[j], facecolor=color)
        ax.add_patch(rect)

ax.set_xlabel("Negatives")
ax.set_ylabel("Positives")
plt.show()