h <- 50
w <- 50
grid.step <- 10
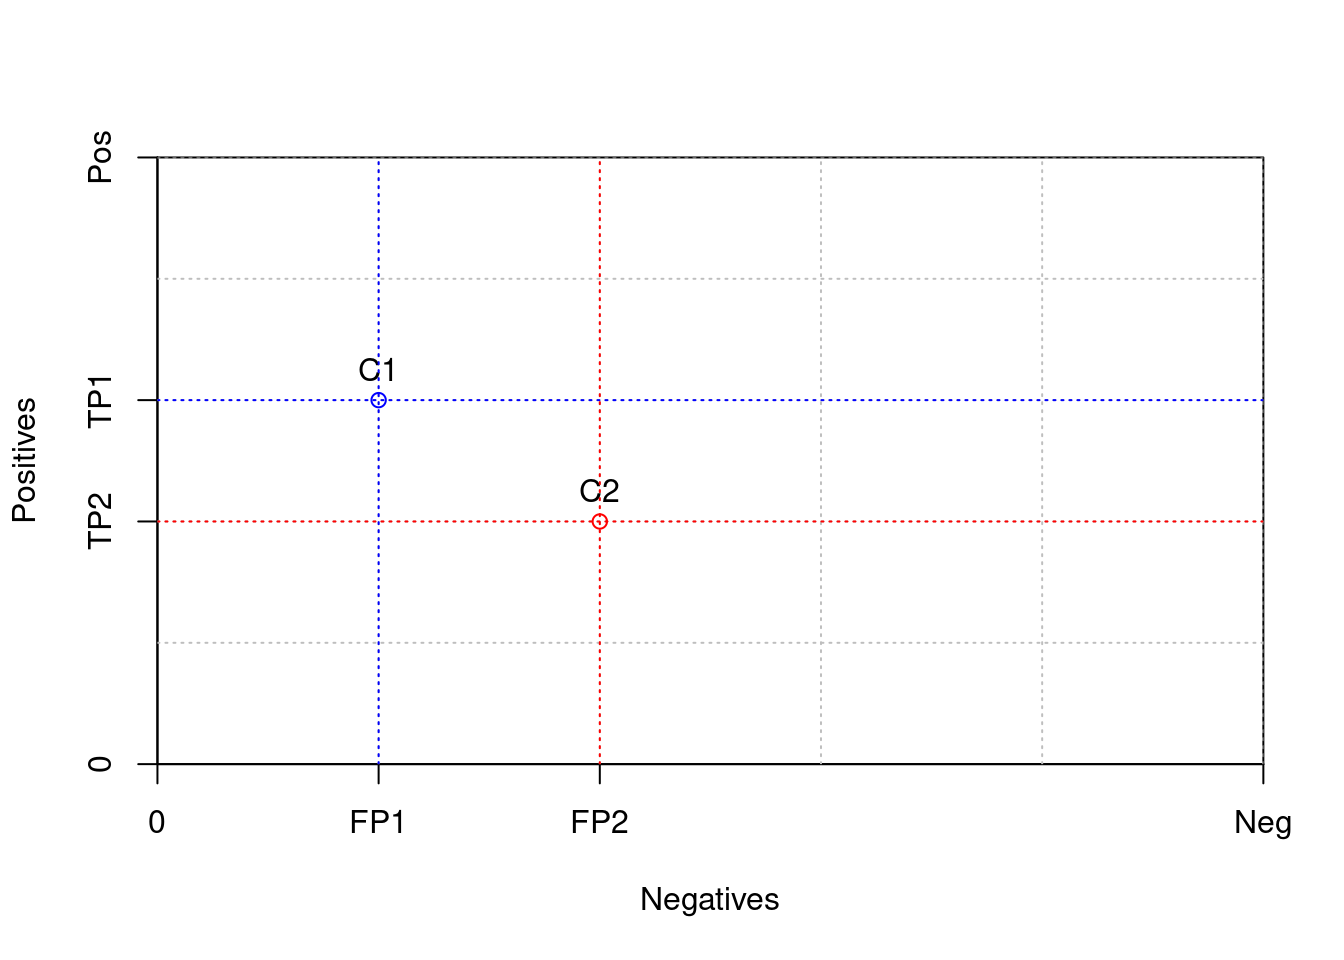
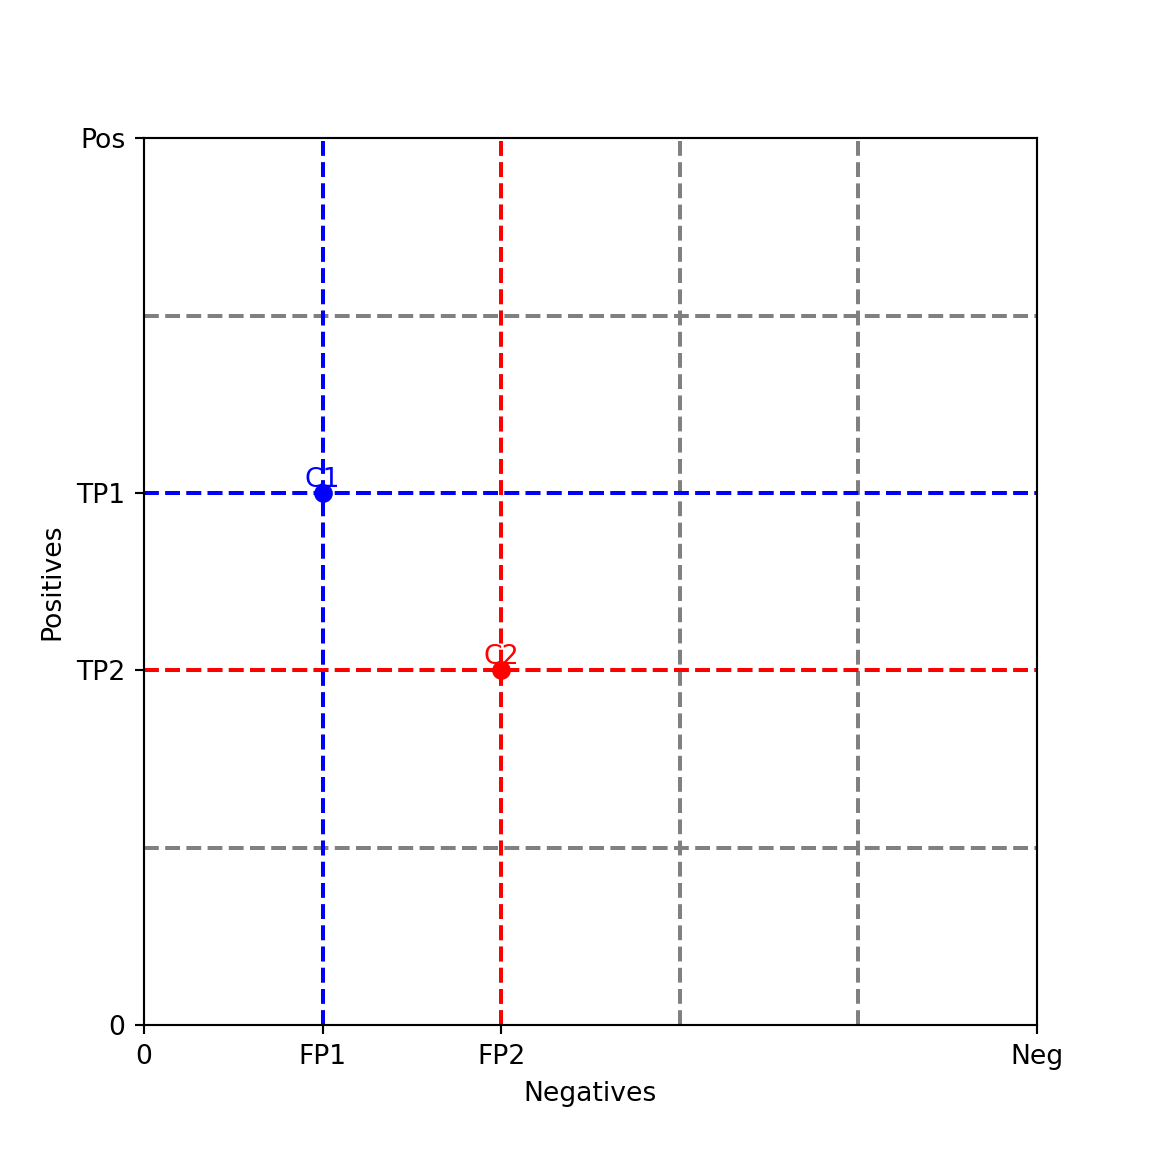
TP1 <- 30
FP1 <- 10
TP2 <- 20
FP2 <- 20
plot( c(0,w), c(0,h),
xaxs = "i",yaxs = "i",
xaxt = 'n', yaxt = 'n',
type = "n",
xlab = "Negatives", ylab = "Positives")
axis(2,c(0,TP2,TP1,h),labels=c('0','TP2','TP1','Pos'))
axis(1,c(0,FP1,FP2,w),labels=c('0','FP1','FP2','Neg'))
gx <- grid.step
while (gx <= w) {
abline(v = gx, col="gray", lty="dotted")
gx <- gx + grid.step
}
gy <- grid.step
while (gy <= h) {
abline(h = gy, col="gray", lty="dotted")
gy <- gy + grid.step
}
col1 <- "blue"
points( FP1, TP1, col=col1, type="o")
text( FP1, TP1, "C1", pos=3)
abline(h=TP1, v=FP1, col=col1, lty="dotted")
col2 <- "red"
points( FP2, TP2, col=col2, type="o")
text( FP2, TP2, "C2", pos=3)
abline(h=TP2, v=FP2, col=col2, lty="dotted")