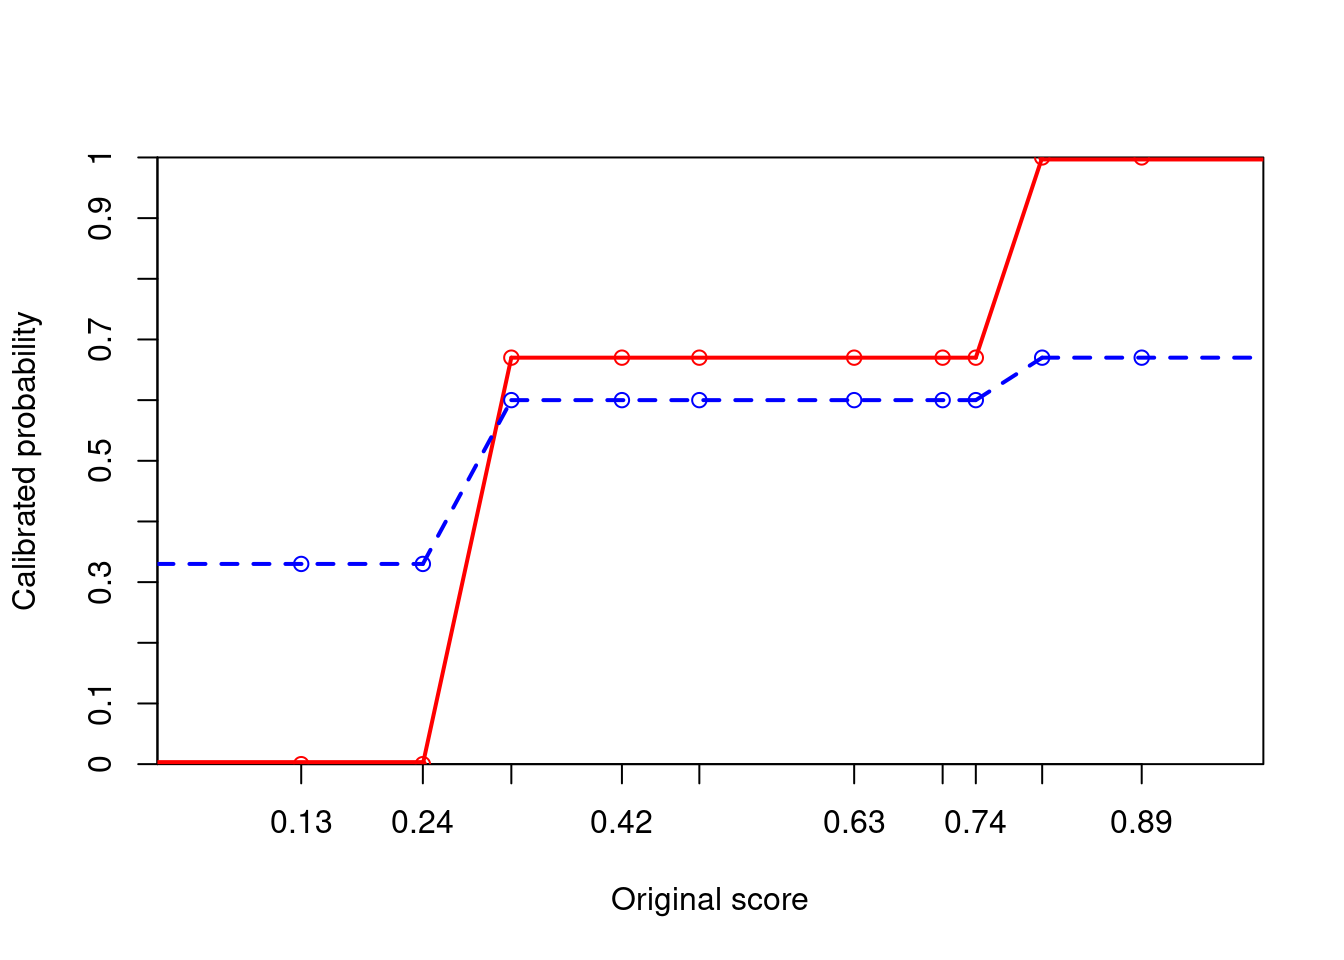
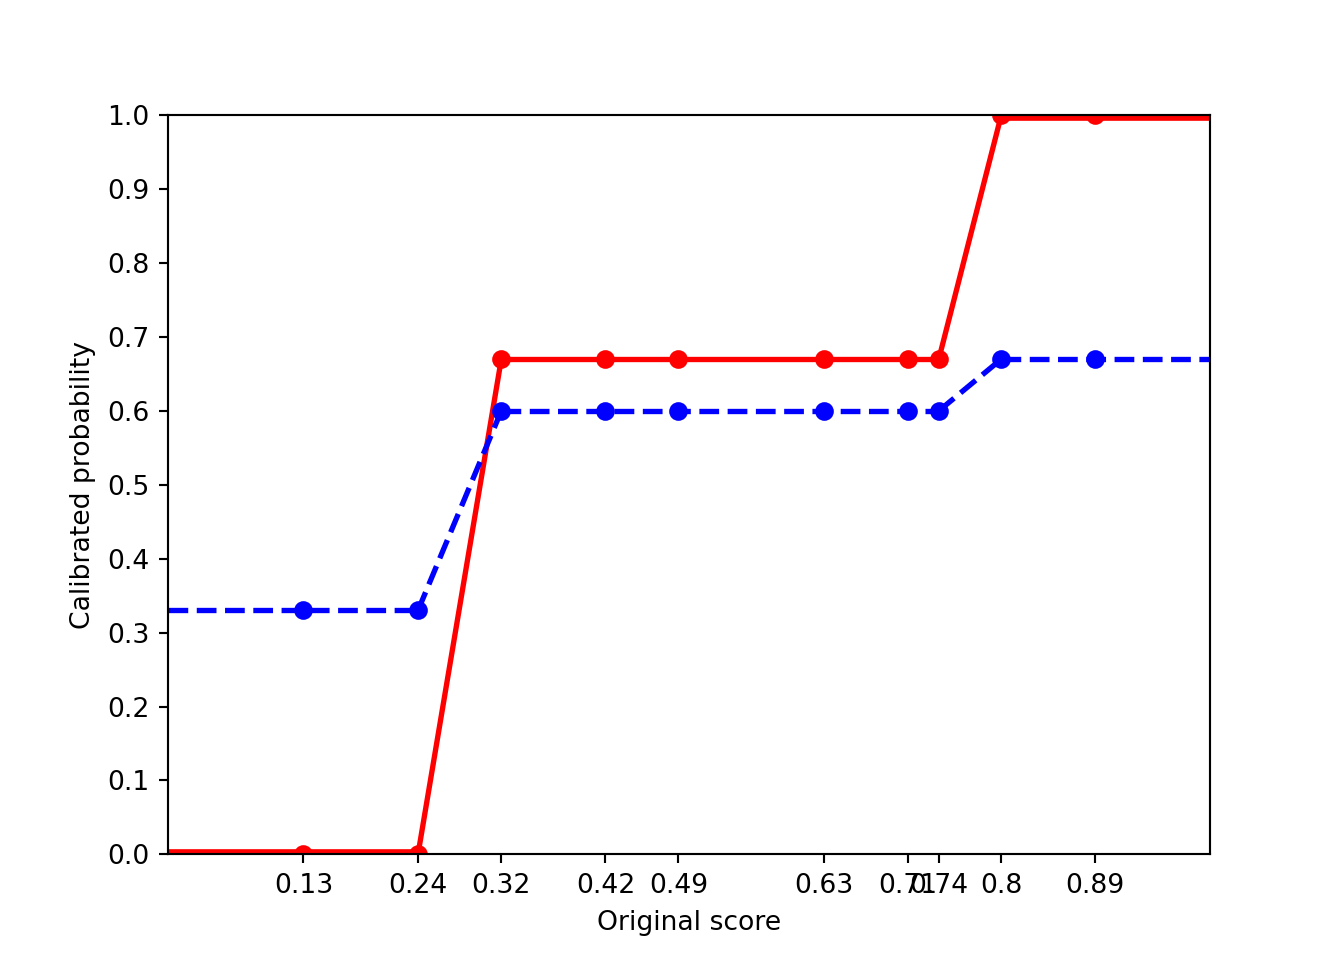
x <- c(13, 24, 32, 42, 49, 63, 71, 74, 80, 89)
y <- c(0, 0, 67, 67, 67, 67, 67, 67, 100, 100)
y1 <- c(33, 33, 60, 60, 60, 60, 60, 60, 67, 67)
y2 <- c(25, 25, 63, 63, 63, 63, 63, 63, 75, 75)

h <- 100
w <- 100
grid.step <- 10

plot(
  c(0, w), c(0, h),
  xaxs = "i", yaxs = "i",
  xaxt = 'n', yaxt = 'n',
  type = "n",
  xlab = "Original score",
  ylab = "Calibrated probability"
)

axis(1, at = x, labels = x / 100)
axis(2, at = seq(0, h, grid.step), labels = seq(0, h, grid.step) / 100)

col <- "red"
lwd <- 2
lines(x, y, lty = 0, type = 'o', col = col)
segments(0, y[1], x[2], y[2], lwd = 4, col = col)
segments(x[2], y[2], x[3], y[3], lwd = lwd, col = col)
segments(x[3], y[3], x[8], y[8], lwd = lwd, col = col)
segments(x[8], y[8], x[9], y[9], lwd = lwd, col = col)
segments(x[9], y[9], 100, y[10], lwd = 4, col = col)

col <- "blue"
lty <- "dashed"
lines(x, y1, lty = 0, type = 'o', col = col)
segments(0, y1[1], x[2], y1[2], lty = lty, lwd = lwd, col = col)
segments(x[2], y1[2], x[3], y1[3], lty = lty, lwd = lwd, col = col)
segments(x[3], y1[3], x[8], y1[8], lty = lty, lwd = lwd, col = col)
segments(x[8], y1[8], x[9], y1[9], lty = lty, lwd = lwd, col = col)
segments(x[9], y1[9], 100, y1[10], lty = lty, lwd = lwd, col = col)