import numpy as np
import matplotlib.pyplot as plt
plt.style.use('ggplot')
x = 4 * np.random.rand(100, 1) - 2
y = np.sqrt(4 - x ** 2)
xe = x + np.random.normal(0, 0.1, (100, 1))
ye = y + np.random.normal(0, 0.1, (100, 1))
mean = [0, 0]
cov = [[0.5, 0], [0, 0.5]]
p = np.random.multivariate_normal(mean, cov, 100)
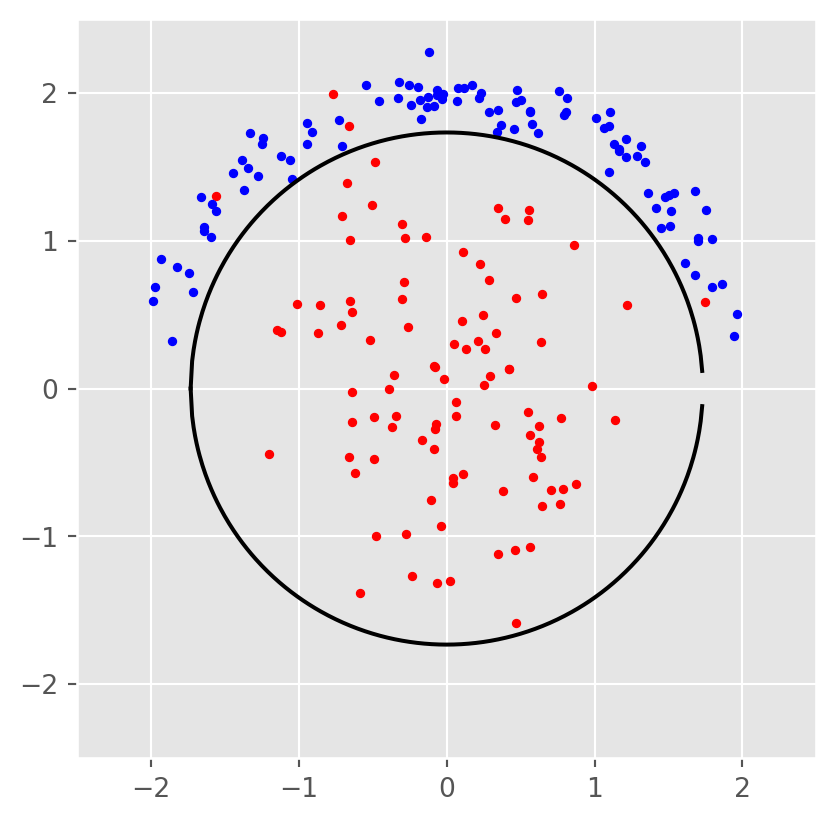
xaxis = np.arange(-np.sqrt(3), np.sqrt(3), 0.01)
plt.figure(1)
plt.axis("square")
plt.xlim([-2.5, 2.5])
plt.ylim([-2.5, 2.5])
plt.scatter(p[:, 0], p[:, 1], color='r', marker='.')
plt.scatter(xe, ye, color='b', marker='.')
plt.plot(xaxis, np.sqrt(3 - xaxis ** 2), 'k-')
plt.plot(xaxis, -np.sqrt(3 - xaxis ** 2), 'k-')
plt.savefig("kernel-left.pdf")
plt.show()
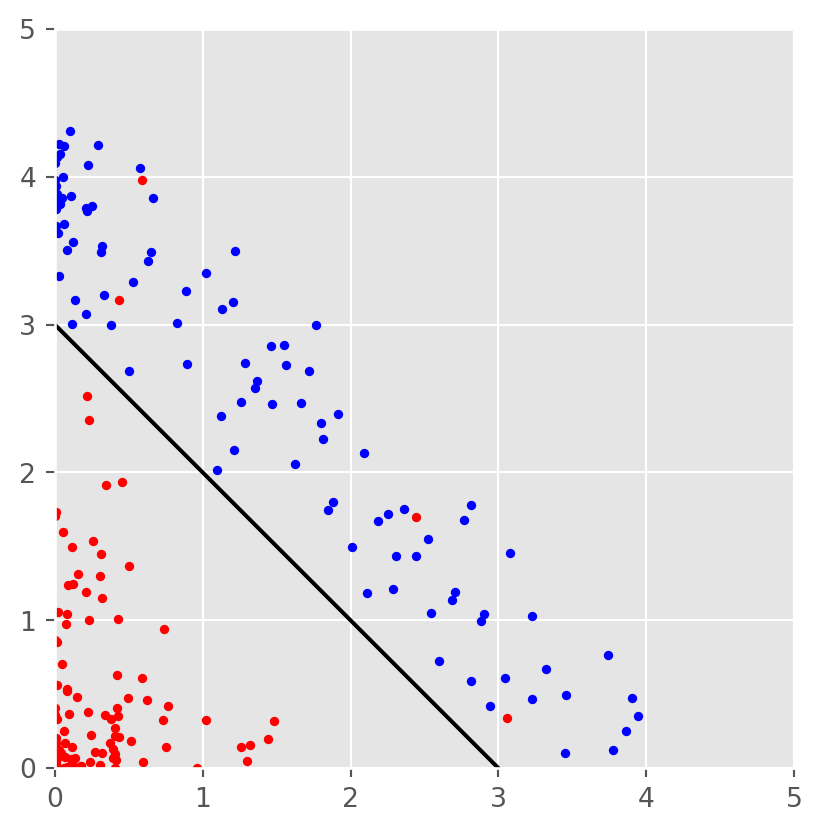
plt.figure(2)
plt.axis("square")
plt.xlim([0, 5])
plt.ylim([0, 5])
plt.scatter(xe ** 2, ye ** 2, color='b', marker='.')
plt.scatter(p[:, 0] ** 2, p[:, 1] ** 2, color='r', marker='.')
plt.plot([0, 3], [3, 0], color='black')
plt.savefig("kernel-right.pdf")
plt.show()