import numpy as np
import matplotlib.pyplot as plt
mupos = 90
muneg = 70
sigma = 20
Pos = 50
Neg = 50
px = np.random.normal(mupos, sigma, Pos)
nx = np.random.normal(muneg, sigma, Neg)
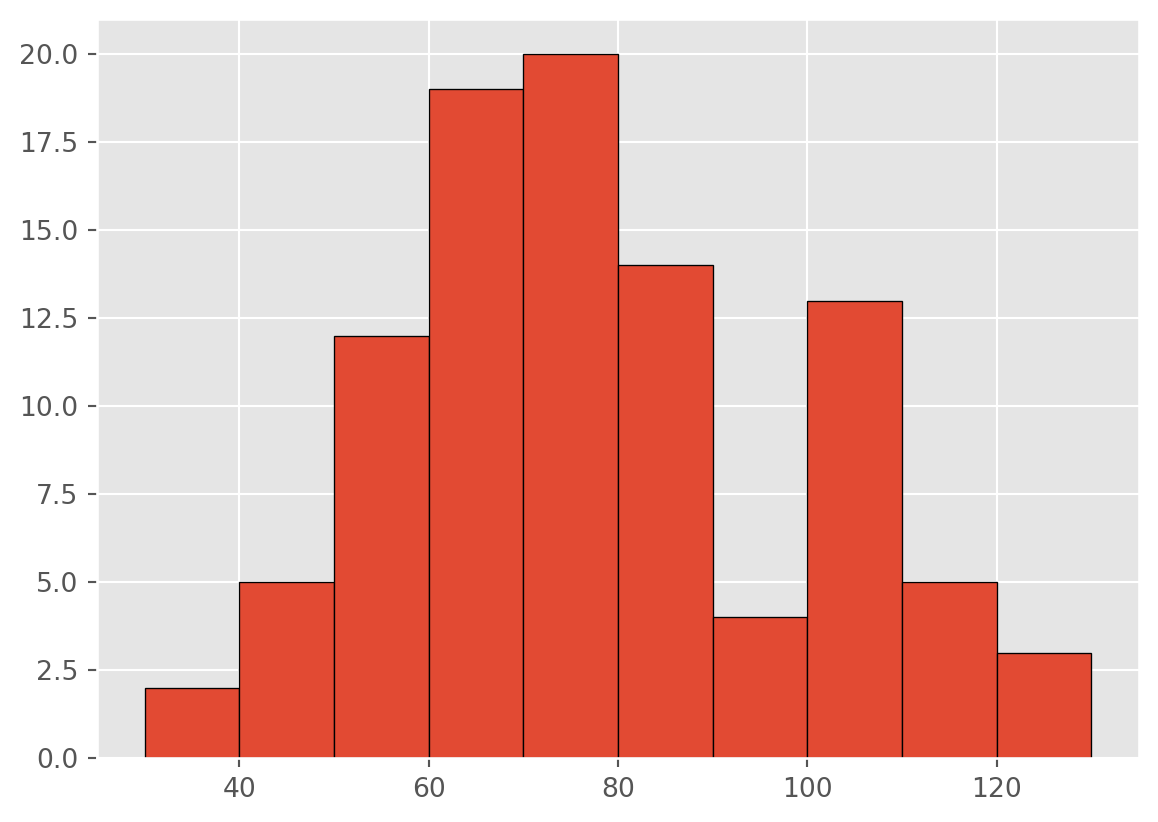
bins = np.arange(muneg - 2 * sigma, mupos + 2 * sigma + 10, 10)
counts, xout = np.histogram(np.concatenate((px, nx)), bins)
plt.style.use('ggplot')
plt.figure(1)
plt.bar(xout[:-1], counts, width=10, align='edge', edgecolor = "black")
plt.show()
counts = counts.reshape(-1, 1)
p = counts[:, 0] / (counts[:, 0] + counts[:, 0])
TP = 0
FP = 0
tp = [0]
fp = [0]
for i in range(len(counts)):
tp.append(TP)
fp.append(FP)
TP += counts[i, 0]
FP += counts[i, 0]
tp.append(TP)
fp.append(FP)
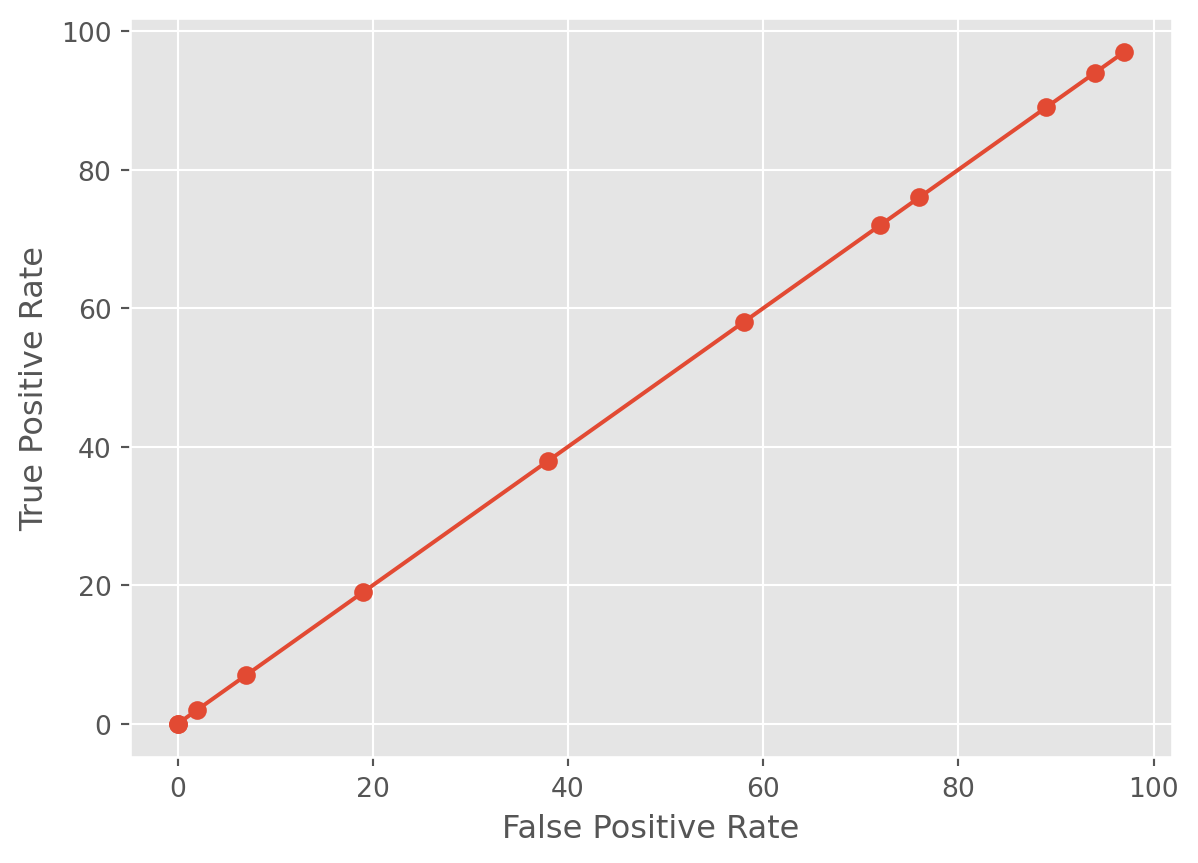
plt.figure(2)
plt.plot(fp, tp, marker='o')
plt.xlabel('False Positive Rate')
plt.ylabel('True Positive Rate')
plt.show()
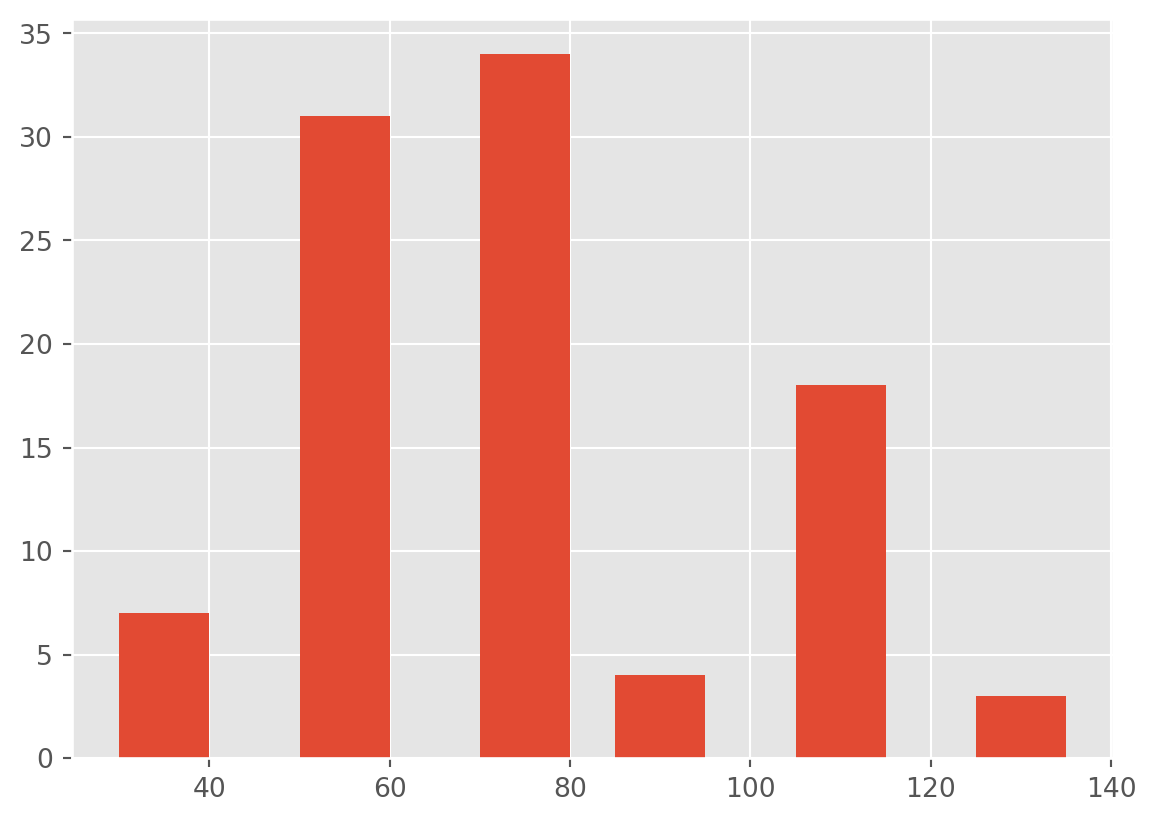
counts2 = np.zeros((6, 1))
counts2[0] = counts[0] + counts[1]
counts2[1] = counts[2] + counts[3]
counts2[2] = counts[4] + counts[5]
counts2[3] = counts[6]
counts2[4] = counts[7] + counts[8]
counts2[5] = counts[9] + counts[10] if len(counts) > 10 else counts[9]
bins2 = [35, 55, 75, 90, 110, 130]
plt.figure(3)
plt.bar(bins2, counts2.flatten(), width=10, align='center')
plt.show()